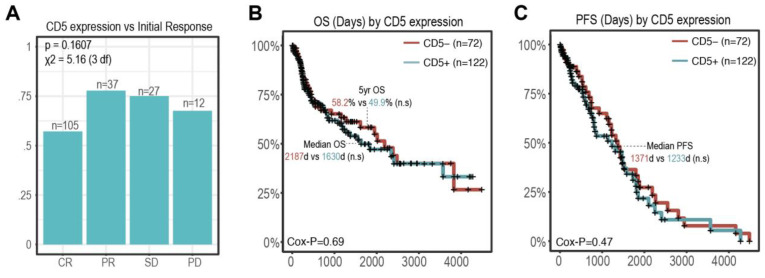
Figure 3.
CD5 status and response to treatment. (A) Proportion of CD5+ patients by initial response. p-values are shown above the chi-square test statistic with 3 degrees of freedom. (B,C) OS and PFS Kaplan Meier curves by CD5 expression status. Log likelihood p-value from Cox proportional hazard test is shown in the bottom left. Key survival summary statistics (5-Yr OS, median OS/PFS) are labeled within each graph. (n.s: non significant).

