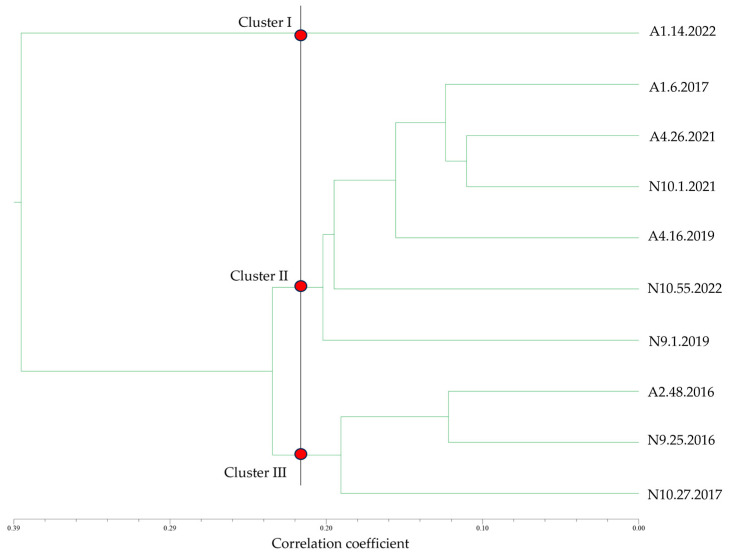
Figure 8.
Similarity dendrogram, constructed using the Euclidean distance as a measure of association and the agglomeration method based on the unweighted pair group method with arithmetic mean (UPGMA). Legend: A—Azeitão cheese factories; N—Nisa cheese factories. The black line delineates the boundaries between the different clusters of biofilm producers. Cluster I—best producer; cluster II—intermediate producers; cluster III—worst producers.

