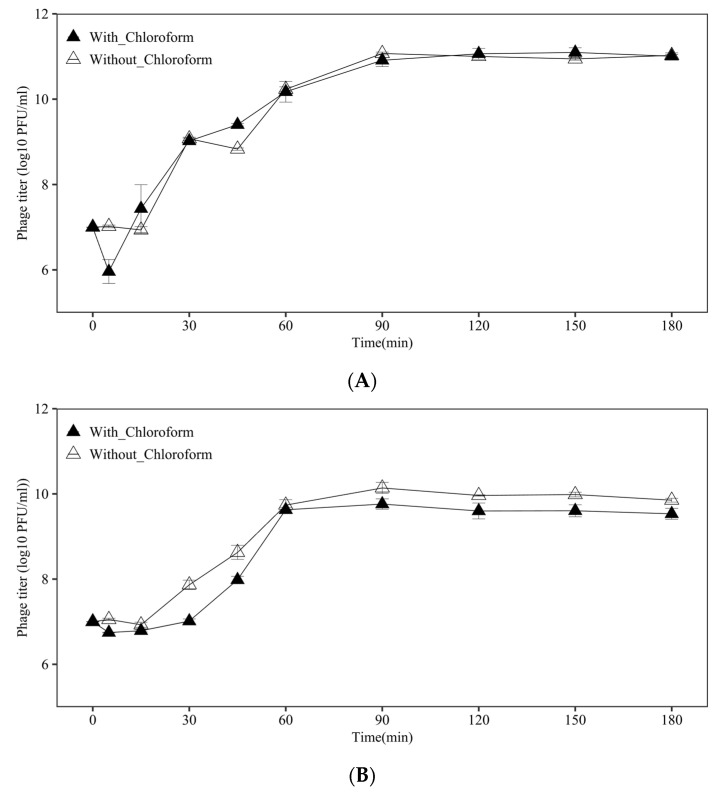
Figure 5.
One-step growth curve of S. typhimurium ATCC 14028 treated with (A) Salmonella phage SPYS_1 and (B) Salmonella phage SPYS_2 at an MOI of 0.1 at 37 °C. Filled triangles represent the phage samples treated with chloroform and unfilled triangles represent the phage samples treated without chloroform. The values are the average of three biological replicates; error bars represent standard errors.

