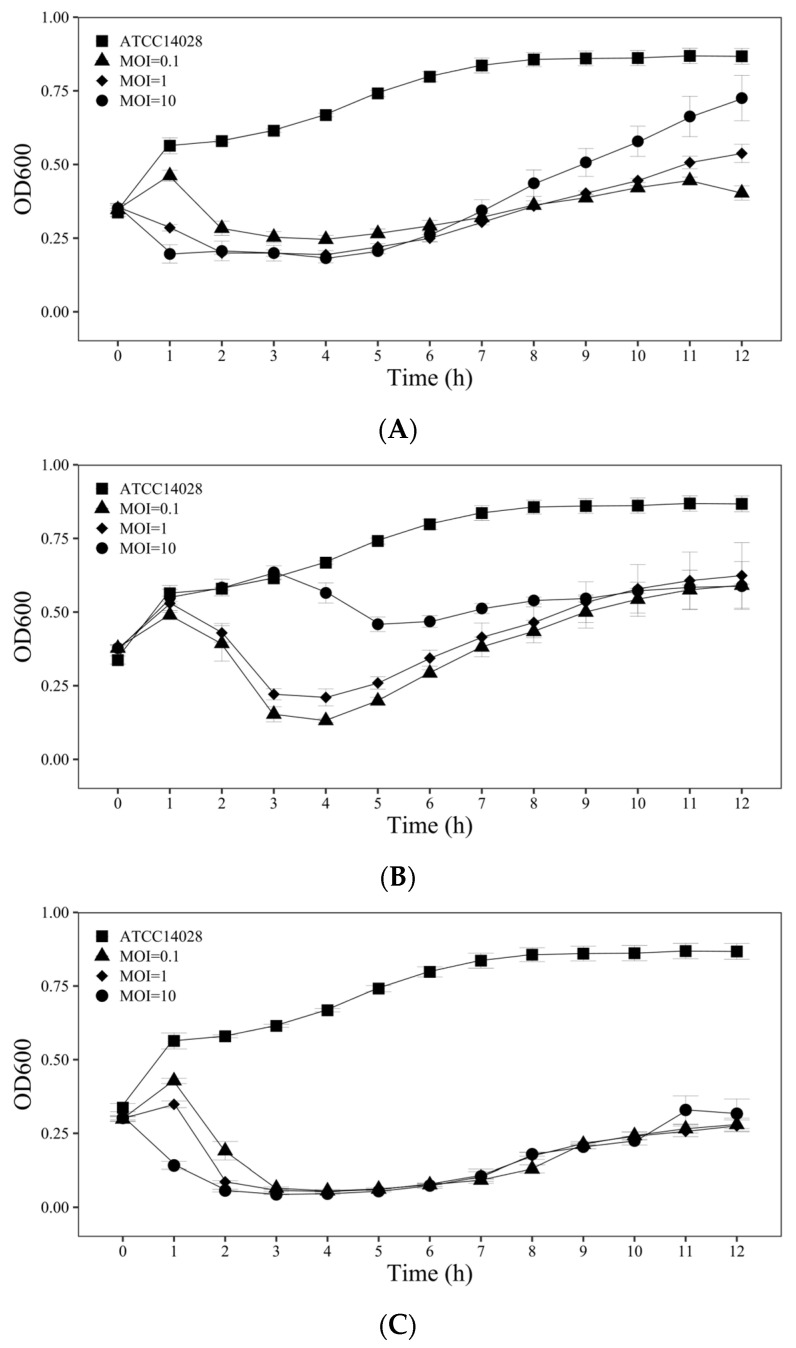
Figure 6.
Inhibition growth curve of S. typhimurium ATCC 14028 treated with (A) Salmonella phage SPYS_1, (B) Salmonella phage SPYS_2, or (C) a mixture of phages at different MOIs. Filled squares represent the samples treated with SM buffer, filled triangles represent samples treated at an MOI of 0.1, filled diamonds represent samples treated at an MOI of 1, filled circles represent samples treated at an MOI of 10. The values are the average of three biological replicates, error bars represent standard errors.

