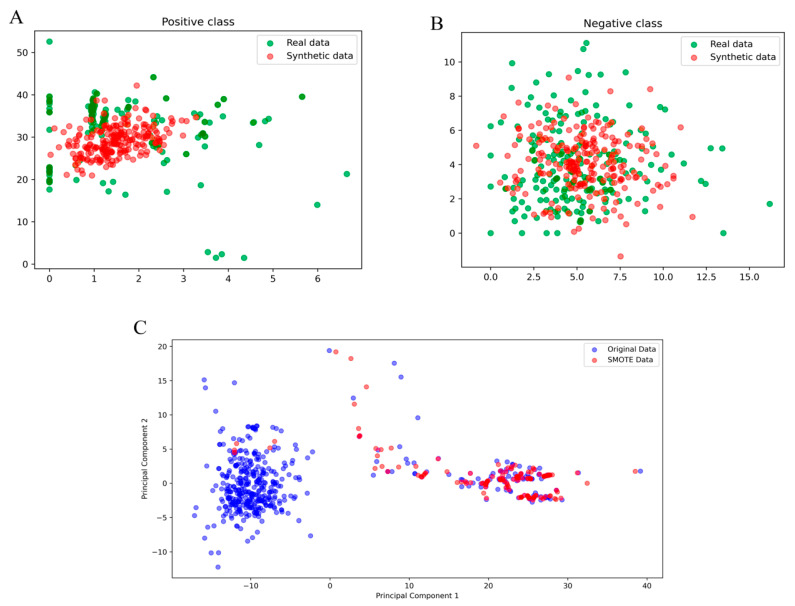
Figure 2.
Visualization of synthetic data generated by a Generative Adversarial Network (GAN) and by Synthetic Minority Over-sampling Technique (SMOTE). Panels (A,B) show the comparison of real and synthetic data for the positive and negative classes, respectively, using a GAN. Panel (C) shows the comparison of original and SMOTE-generated data in a principal component space. Real data are represented in green and synthetic data in red in panels (A,B), while in panel (C), the original data are in blue and SMOTE-generated data are in red.

