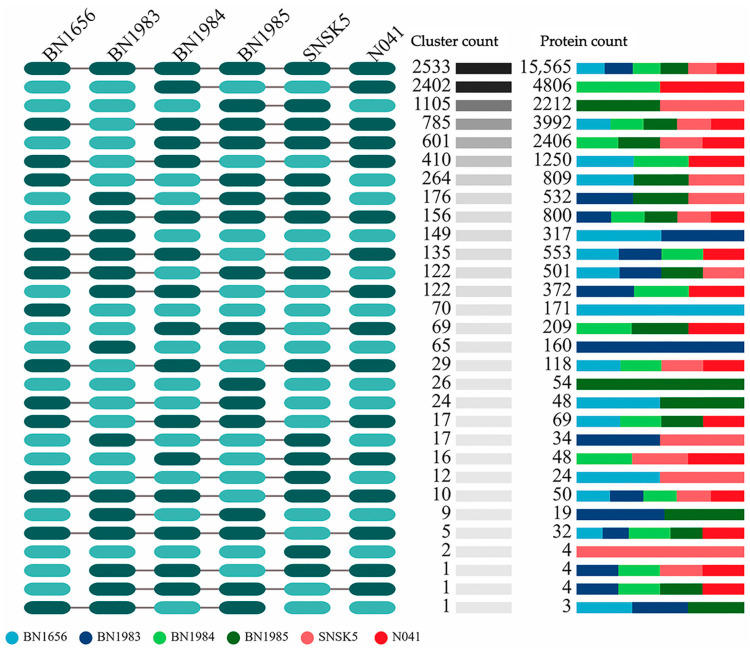
Figure 6.
Illustration of the gene family clusters within the six mycobacterial isolates from this study. The diagram shows both the common and unique gene clusters with the respective number of proteins. The oval shapes in the inverted box on the left represent overlaps between the isolates. The dark-green shading represents overlapping gene families, while the light-green shading represents no overlap.

