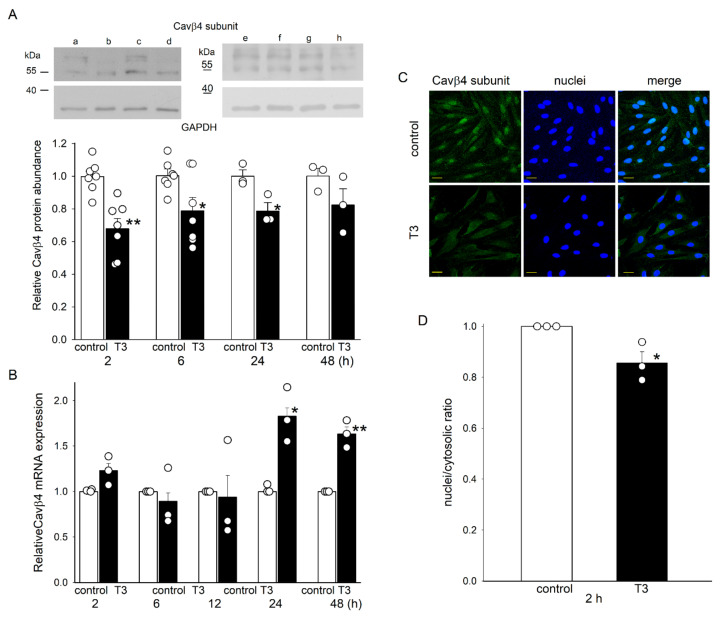
Figure 2.
Relative Cavβ4 protein abundance in H9c2 cells after incubation with T3. (A) Means ± SEMs of relative Cavβ4 protein abundance in H9c2 cells (n = 3–7). Insets show representative blots under control conditions (a, c, e, and g) and 2, 6, 24, and 48 h after T3 incubation (lanes b, d, f, and h, respectively) from four separate experiments. GAPDH bands were used to normalize Cavβ4 subunit density values. Original blots are presented in Figure S1. (B) Means ± SEMs of relative Cavβ4 subunit mRNA expression in H9c2 cells after incubation with T3. (C) Confocal microscopic images of H9c2 cells under control conditions and after T3 treatment for 2 h. Representative images from three independent experiments show the co-localization of the Cavβ4 subunit (green) with Hoechst 33342-labeled nuclei (blue). Calibration bar, 32 μm. (D) Means ± SEMs of the nuclei/cytosolic ratio from three separate experiments. In panels (A,B,D), each symbol represents a separate experiment. * p < 0.05, ** p < 0.01.

