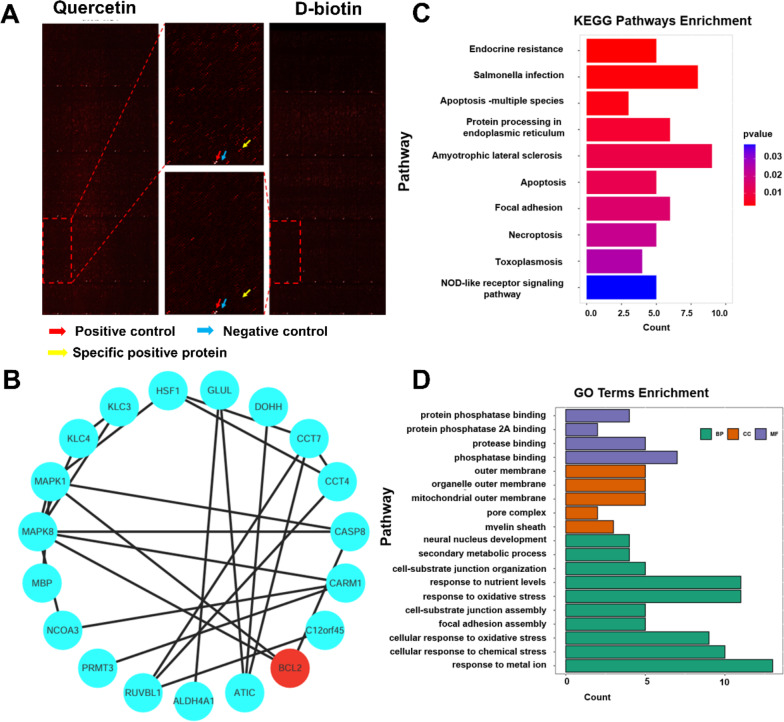
Fig. 6.
Identification of QC-binding proteins. (A) The protein microarray representation depicts red arrows as positive points, blue arrows as negative control points, and yellow arrows as specific positive protein points. (B) Visualization results of the protein–protein interaction network of specific positive protein. (C) The KEGG pathway analysis is performed on specific positive proteins to elucidate the pathways associated with BCL-2. The bar length corresponds to the number of target genes, while the bar colors correspond to the different values of p-value. (D) GO functional enrichment analysis associated with BCL-2 in specific positive proteins, including biological processes (BP), molecular functions (MF), and cellular components (CC)

