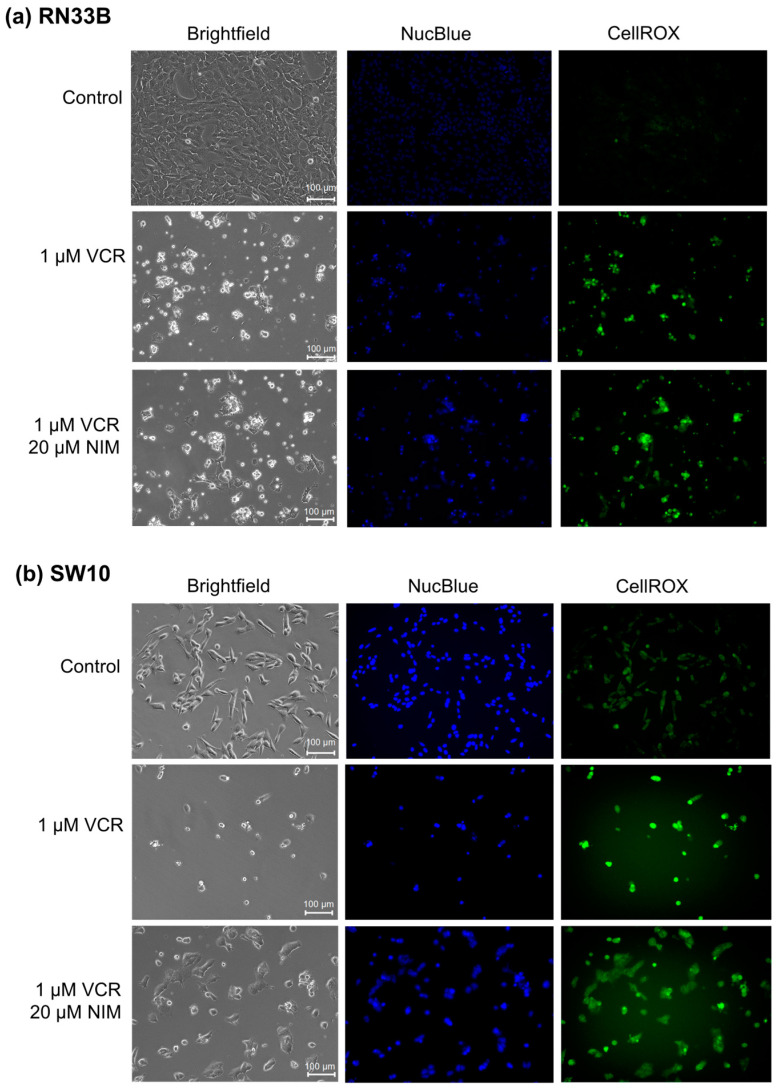
Figure 1.
Microscopic images of RN33B (a) and SW10 (b) cells with 100× magnification. Top row shows control. Middle row shows cells after 24 h treatment with VCR. Bottom row shows cells after 24 h pretreatment of cells with NIM and subsequent addition of VCR. Brightfield (first column) and fluorescence microscopic images with NucBlue™ staining (blue, middle column) and CellROX™ (green, right column). Scale bar = 100 µm.

