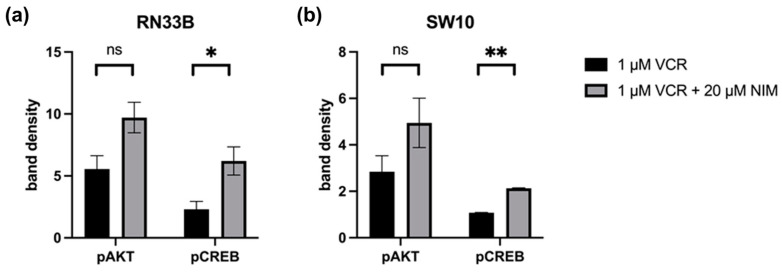
Figure 6.
Quantification of pAKT and pCREB. Quantification of the bands in RN33B (a) and SW10 (b) was normalized to the GAPDH control. The mean values including standard deviation are shown. Two independent biological replicates were analyzed. Student’s t-test was performed for statistical analysis. * p < 0.05; ** p < 0.01; ns: not significant.

