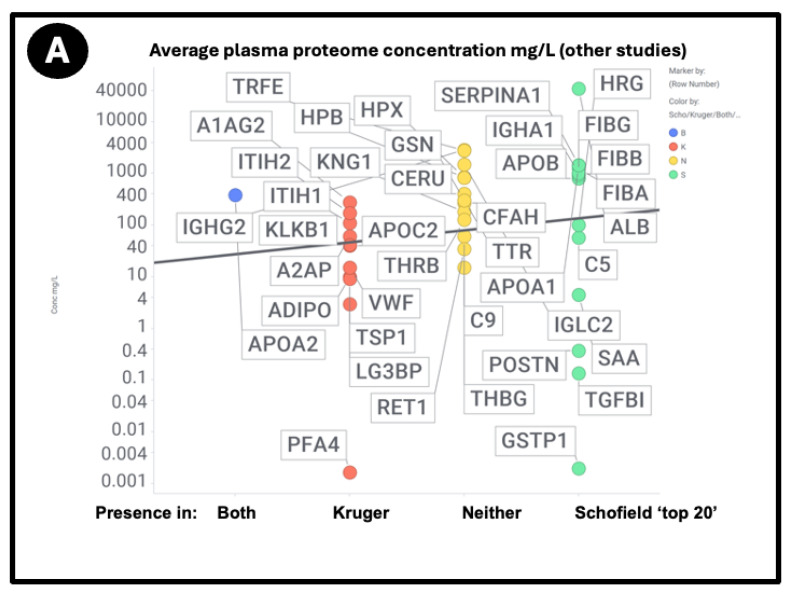
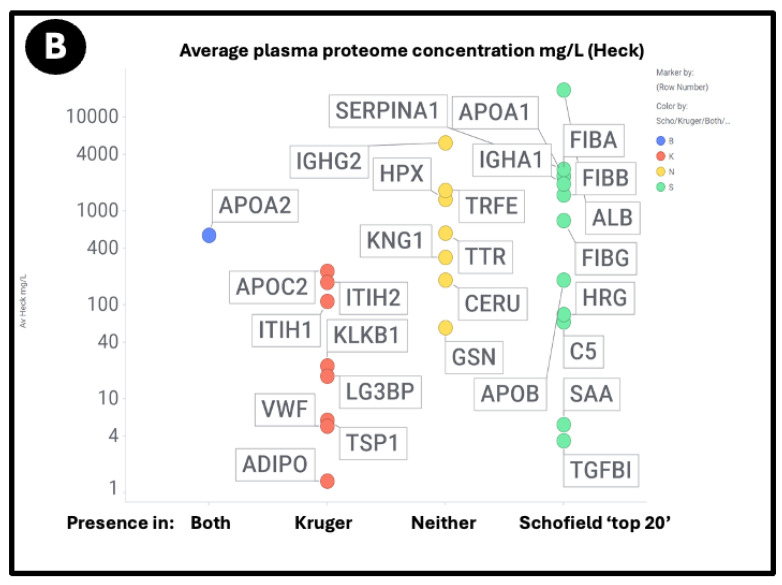
Figure 9.
Relationship between the standard plasma proteome concentrations (taken from [391]) and their detection in the Kruger (K), Schofield (S), both (B) studies, or neither (N). Size of symbol encodes protein length in residues. Abbreviations as in list of abbreviations. (A) protein concentrations from other studies delineated in the text and the supplementary spreadsheet. (B) Proteins from the study of Heck and colleagues [391].


