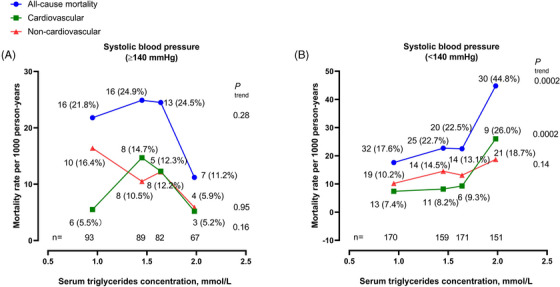
FIGURE 2.

Age‐standardized mortality rate per 1000 person‐years according to the quartile distributions of fasting serum triglycerides concentration in untreated patients with a systolic blood pressure of ≥140 mmHg (A) or < 140 mmHg (B). The number of participants is given for each quartile at the bottom of the figure. The number of deaths (rate per 1000 person‐years) is given for each quartile alongside the symbols.
