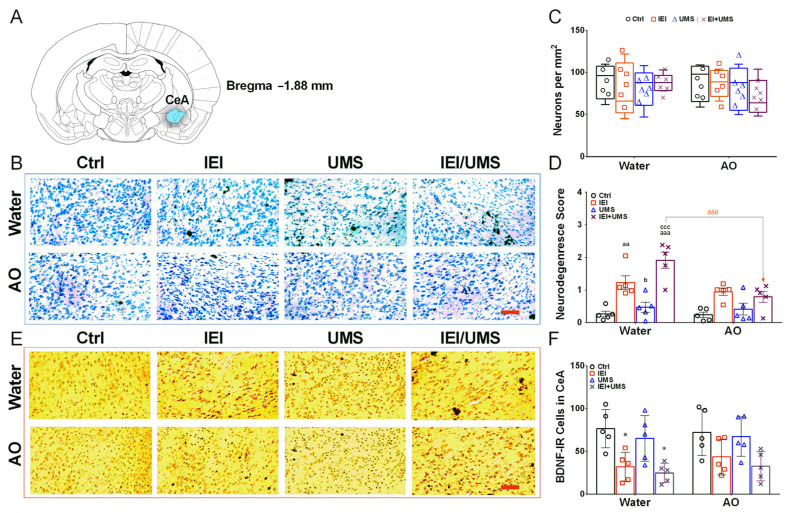
Figure 3.
Histologic neurodegeneration and BDNF immunoreactivity analysis in the CeA. (A) Brain anatomical positions of the CeA, relative to Bregma −1.88 mm from the rat brain atlas [30]. (B) Representative images of Nissl-stained forebrain CeA sections. (C) Number of neurons per mm2 assessed by cell counting and (D) Semi-quantitative analysis of neurodegeneration (score) in rats CeA sections. (E) Representative images showing BDNF—immunolabelling observed in the CeA sections. (F) Positive BDNF-IR cell counts in the CeA sections in Ctrl (n = 5), IEI (n = 4), UMS (n = 5) and IEI/UMS (n = 5) groups under water or AO treatment. Results are expressed as mean ± SEM from 5 animals per group. a p < 0.05, aa p < 0.001 and aaa p < 0.001 compared to Ctrl group; b p < 0.05 compared to the IEI group; ccc p < 0.001 compared to the UMS group; δδδ p < 0.001 AO effect (water-treated IEI/UMS vs. AO-treated IEI/UMS). The data of neuron counting are illustrated as box-and-whisker plots. Scale bar = 50 µm. CeA: the central nucleus of the amygdala, AO: Argan oil, BDNF-IR cells: brain-derived neurotrophic factor—immunoreactive cells.

