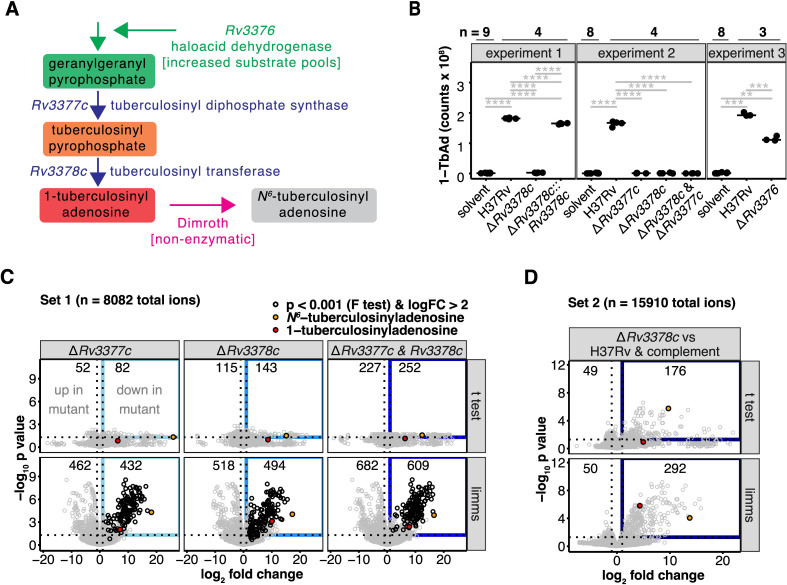
Fig 1. Engineered deletions of 1-TbAd biosynthesis genes reveal gene functions and greatly expand the lipid signature.
(A) Schematic shows the 1-TbAd biosynthetic pathway. (B) Area-under-the-curve of extracted ion chromatograms tested 1-TbAd production by the parental Mtb strain (H37Rv) and single or two-gene knockouts as well as the Rv3378c deletion complemented with Rv3378c. A Benjamini–Hochberg adjusted p value is indicated only for significant pairwise t tests (*: p < 0.05, **: p < 0.01, ***: p < 0.001, ****: p < 0.0001). The peak area in the retention time window corresponding to Mtb H37Rv 1-TbAd [M+H]+ was measured in intervening solvent blank samples to indicate the measurement threshold. (C) Comparative metabolomics analysis showed genetic control of differentially abundant molecules. Positive mode mass spectrometry data were analyzed by comparing deletions in Rv3377c, Rv3378c, or a double deletion of both genes to the H37Rv parental strain. Differential abundance determined using t tests or a linear model fit using limms was compared. The number of significant events (p < 0.05 after adjustment using the Benjamini–Hochberg method) that also changed more than 2-fold were indicated (blue rectangle). The most abundant 1- and N6-tuberculosinyladenosine peaks are flagged (red and orange circles, respectively). Using limms, events with similar patterns of change in all 3 comparisons were determined by F-test. Events with >4-fold decrease in all 3 mutants and p < 0.001 (Benjamini–Hochberg adjusted p value of the F-test) are shown in black. (D) An independent metabolomic comparison of the Rv3378c deletion to H37Rv parent strain and the Rv3378c deletion complemented with Rv3378c was analyzed for differentially abundant positive mode events. Significantly changed events were determined using t tests or limms. The numbers of changed events (Benjamini–Hochberg adjusted p < 0.05 and 2-fold or greater change), the gene-dependent events (blue rectangle), and the most abundant 1- and N6-tuberculosinyladenosine peaks are indicated as in Fig 2A. The data in Fig 1B–1D can be found in S1 Data.

