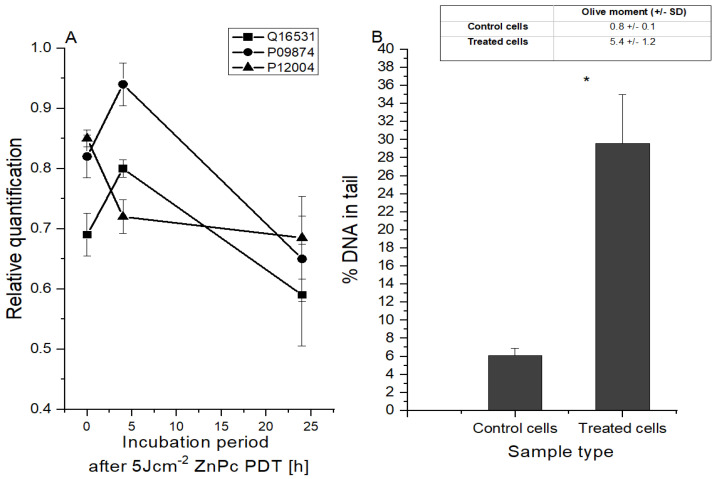
Figure 4.
Changes at the DNA level after 5 Jcm−2 ZnPc PDT. (A) Changes in the protein level depending on the incubation period after the therapy. The relative quantification was calculated as the proportion of protein in the control cell sample compared to the protein level in the treated cell sample. Q16531—DNA damage-binding protein 1; P09874—poly [ADP-ribose] polymerase 1; P12004—proliferating cell nuclear antigen. (B) DNA damage evaluated 24 h after therapy by comet assay using LC50 concentration of zinc phthalocyanine photosensitizer. The control represents the irradiated cells without a photosensitizer (the negative control).). Data are presented as ±SD from three independent measurements. Results were considered statistically significant when p < 0.05 and indicated in the graphs by an asterisk symbol.

