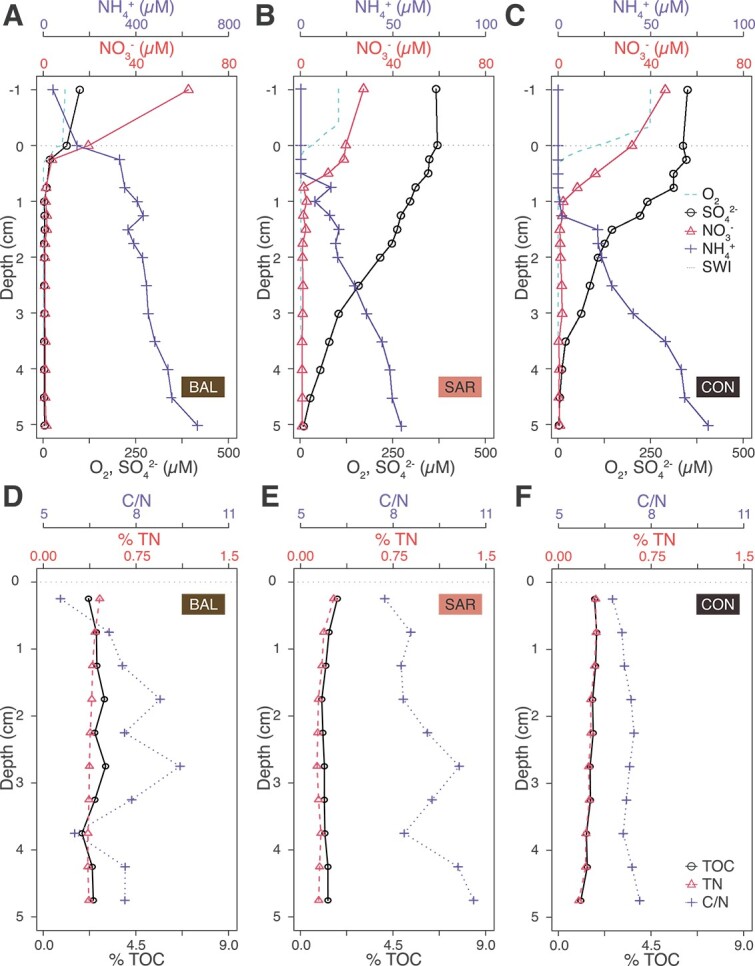
Figure 1.

Representative profiles of porewater chemistry (A-C) showing O2 (dashed line), SO42− (open circles), NO3− (open triangles) and NH4+ (crosses) concentrations (in μM) for an agriculture-influenced lake (BAL, A) a pristine-alpine lake (SAR, B) and a large-deep lake (CON, C). And profiles of bulk organic matter properties (D-F) showing TOC % (black lines), TN % (dashed lines) and molecular C/N ratio (dotted lines) as function of sediment depth for the same lakes. The horizontal dashed line marks the sediment–water interface (SWI). Note that the scale of NH4+ concentrations in the graph (a) differs from that of (b) and (c).
