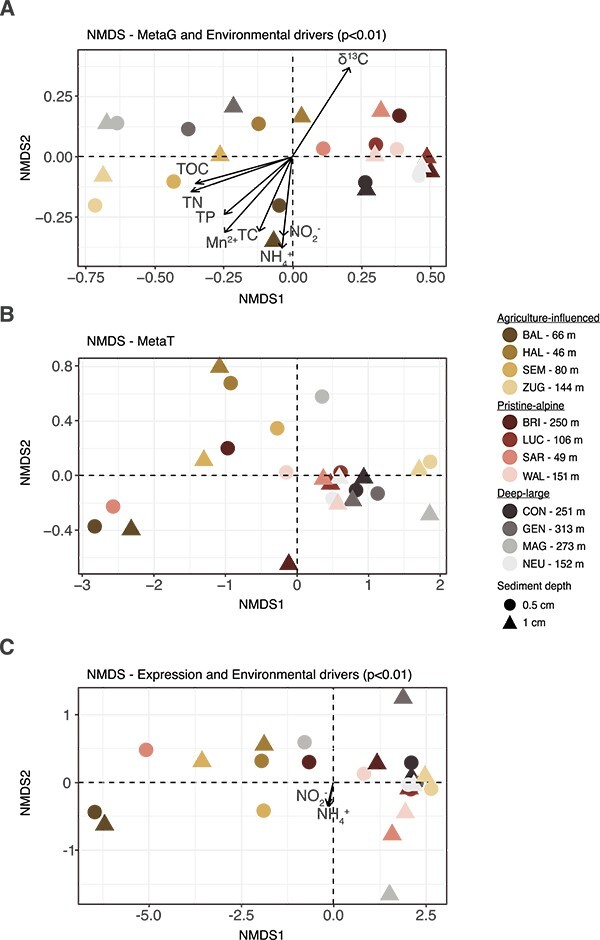
Figure 3.

Non-metric multidimensional scaling ordination analysis based on the normalized abundances of inorganic N genes/cell (A) or their transcripts/cell (B). (C) NMDS of gene expression (log of the ratio of per cell abundance of genes and transcripts). The environmental parameters with the best fit to the ordination (significance level P < 0.01) are shown as vectors (length scaled: Arrow*0.5); there was no significant environmental parameter explaining the transcripts/cell. The samples are colored by the group and shaded by lake (yellow shades = agriculture-influenced lakes, red shades = pristine-alpine lakes, gray shades = deep-large lakes). The symbol indicates the sediment depth. The depth of the water column, where the sediment sample was taken, is indicated.
