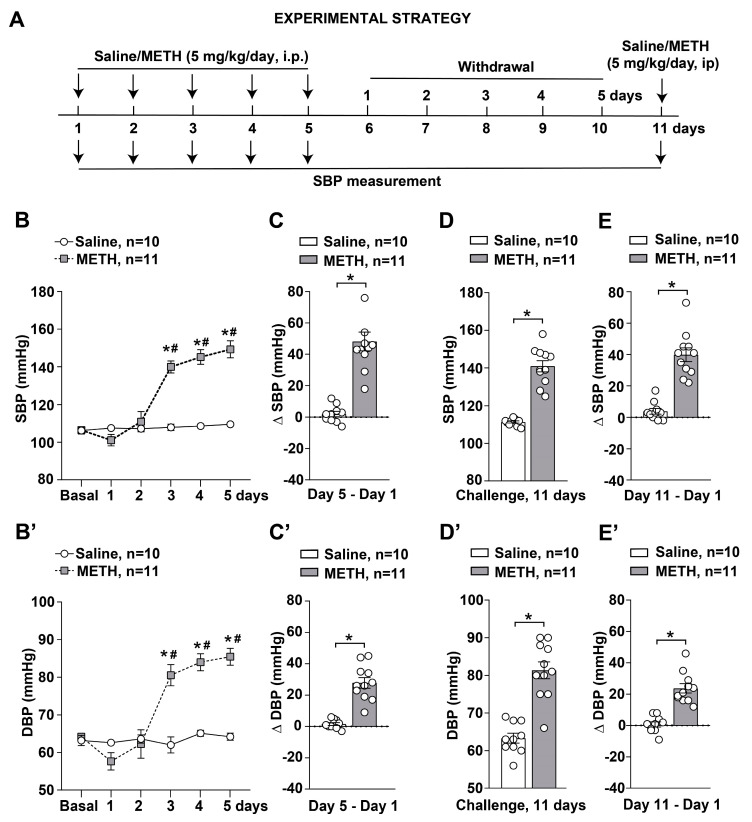
Figure 1.
Methamphetamine (METH) induces SBP and DBP sensitization in mice. (A) Diagram showing the protocol used for monitoring SBP and DBP values in mice subjected to daily intraperitoneal (i.p.) injection of saline or METH (5 mg/kg) for 5 days and then re-challenged with saline or METH following 6 days of withdrawal on day 11. SBP and DBP were monitored by the tail-cuff plethysmography before treatments (Basal) and 30 min after each injection with saline or METH. SBP and DBP values monitored in mice treated with saline or METH for 5 days are shown in (B,B’), respectively. Values are the means ± S.E.M. p < 0.05, (*) vs. saline; (#) vs. Basal, day 1 and day 2 (two-way ANOVA for repeated measures with Bonferroni’s test). Difference in SBP values (Δ SBP) and DBP values (Δ DBP) monitored at 30 min after saline or METH injections between days 5 and day 1 (Day 5–Day 1) is shown in (C,C’), respectively. Values are the means ± S.E.M. * p < 0.05 (unpaired two-tailed Student’s t-test). SBP and DBP values monitored in mice at 30 min after the challenge with saline or METH performed following 6 days of withdrawal on day 11 are shown in (D,D’), respectively. Values are the means ± S.E.M. * p < 0.05 (unpaired two-tailed Student’s t-test). Difference in SBP values (Δ SBP) and DBP values (Δ DBP) monitored at 30 min after saline or METH injections between days 11 and day 1 (Day 11–Day 1) are shown in (E,E’), respectively. Values are the means ± S.E.M. * p < 0.05 (unpaired two-tailed Student’s t-test).

