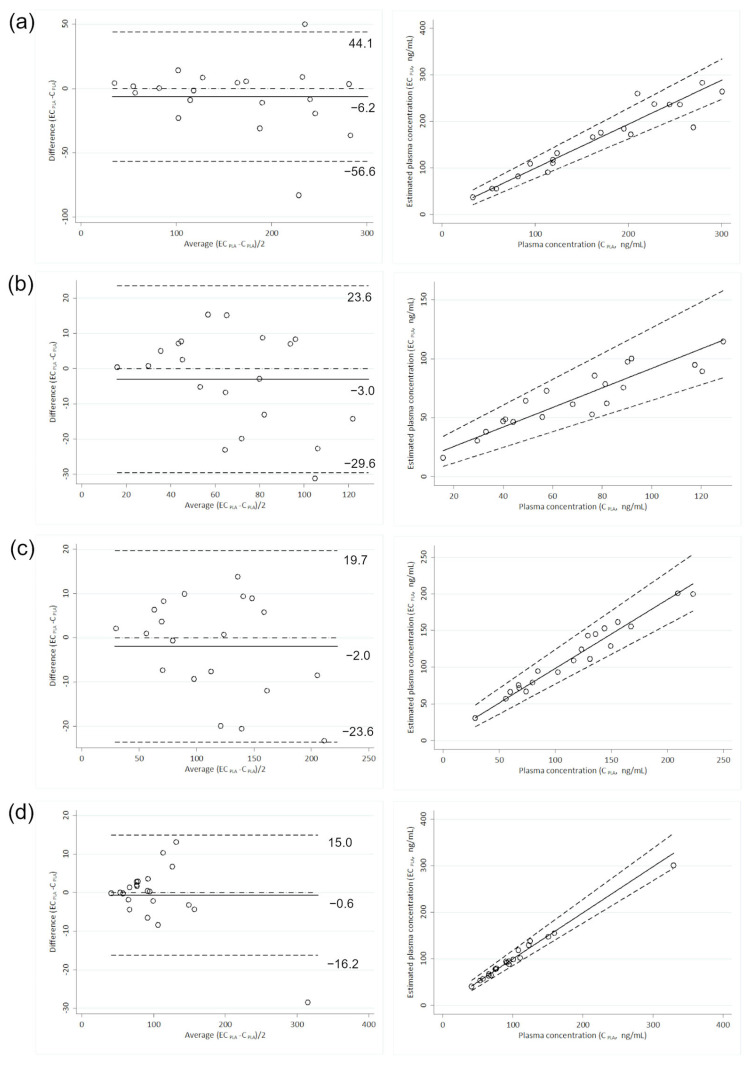
Figure 3.
Relationship between actual and estimated plasma values of abemaciclib (a), M2 (b), M20 (c), and letrozole (d) based on Bland–Altman plot (left) and Passing–Bablok regression (right). The lower and upper limits of agreement (±1.96 SD of the bias) are reported as dashed lines in Bland–Altman plots and expressed as ng/mL, while the bias is reported as a solid line. In the Passing–Bablok regression, the 95% confidence interval is reported as dashed lines.

