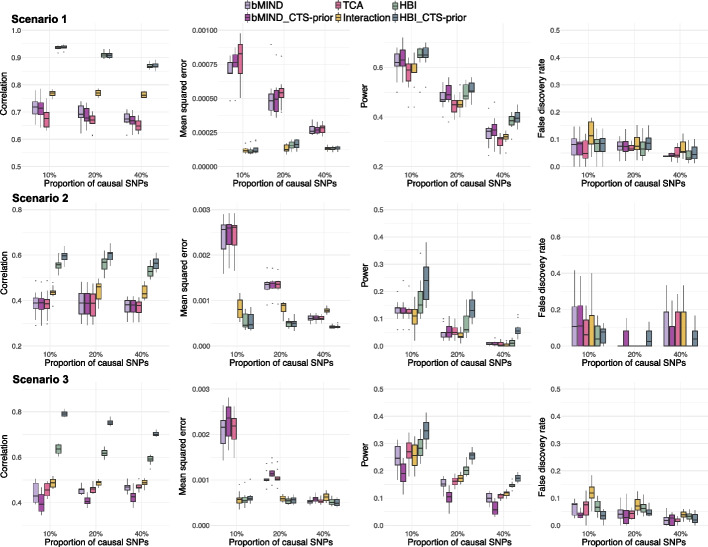
Fig. 2.
Comparisons of performance in estimating cell type-specific (CTS)-meQTLs. From top to bottom: scenarios with genetic effects only in the most abundant cell type (Scenario 1), only in the least abundant cell type (Scenario 2), and with correlated genetic effects in all cell types (Scenario 3) are shown. From left to right: correlation between estimated and true effect sizes, mean squared error (MSE) between estimated and true effect sizes, power, and false discovery rate (FDR) as a function of the proportion of causal SNPs. HBI_CTS-prior, bMIND_CTS-prior represent the version of the corresponding methods with CTS DNA methylation data incorporated

