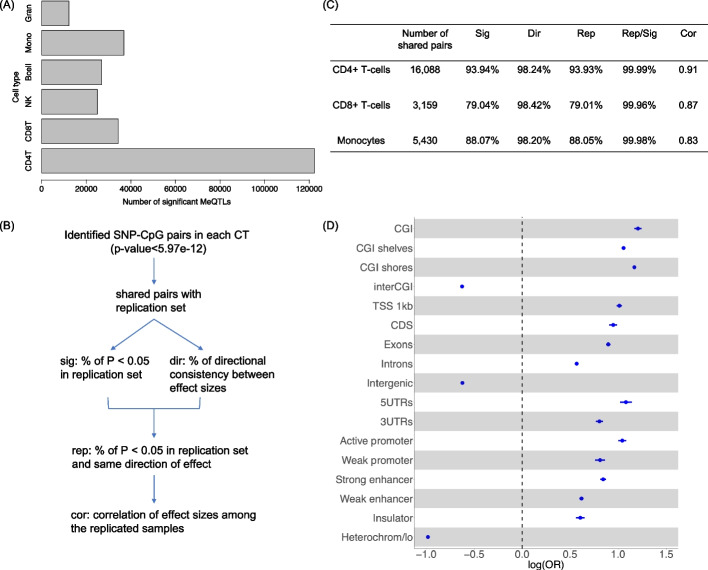
Fig. 3.
Overview of cell type-specific (CTS)-meQTLs identification using the hierarchical Bayesian interaction model (HBI). A Bar chart shows the number of HBI-identified meQTLs in each cell type (p<6E−12). B Flow chart indicates the replication of HBI identified CTS-meQTLs in an independent dataset for meQTLs in isolated white blood cell subsets (CD4+ T-cells, CD8+ T-cells, monocytes). C Table summarizes the replication results. D Functional enrichment for meQTLs across all cell types in CpG island (CGI) regions, gene body regions, and gene regulatory regions. The logarithm of odds ratio (OR) with 95% confidence interval is presented. TSS 1 kb: <1 kb upstream of the transcription start site (TSS); CDS: coding sequence; UTR: untranslated exon region; Heterochrom/lo: regions that exhibit heterochromatic or heterochromatin-like characteristics; CD4T: CD4+ T-cells; CD8T: CD8+ T-cells; NK: natural killer cells; Mono: monocytes; Gran: granulocytes

