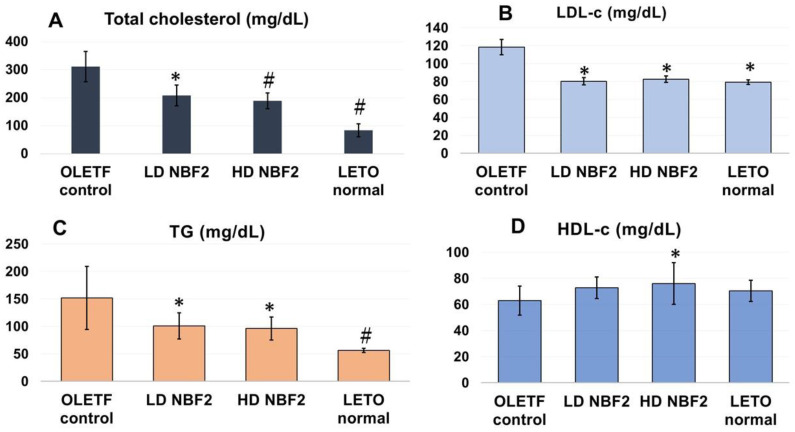
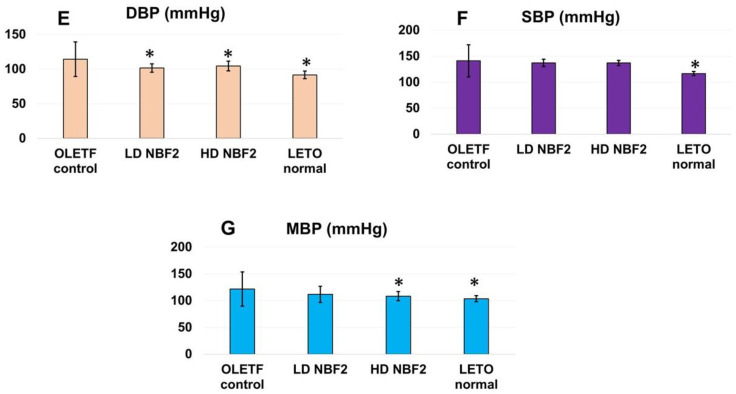
Figure 2.
(A–G) Blood lipid and blood pressure profiles in rats (N = 26). Legend: *, p-value less than 0.05; #, p-value less than 0.01 (by one-way ANOVA); OLETF, Otsuka Long-Evans Tokushima Fatty rats; LETO, Long-Evans Tokushima Otsuka rats; T-chol, total cholesterol; LDL-c, low-density lipoprotein cholesterol; HDL-c, high-density lipoprotein cholesterol; TG, triglyceride.


