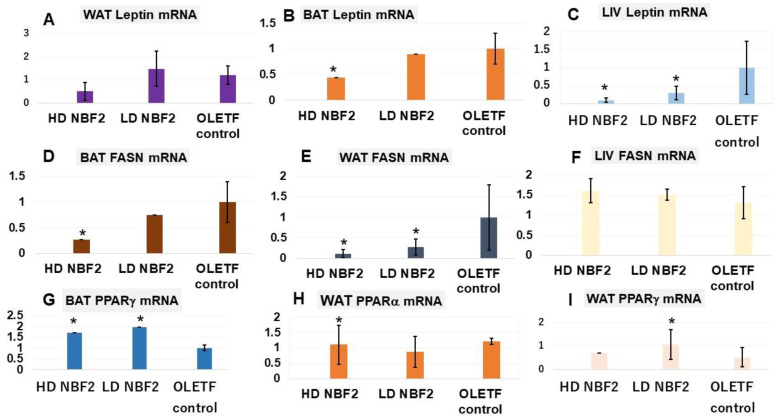
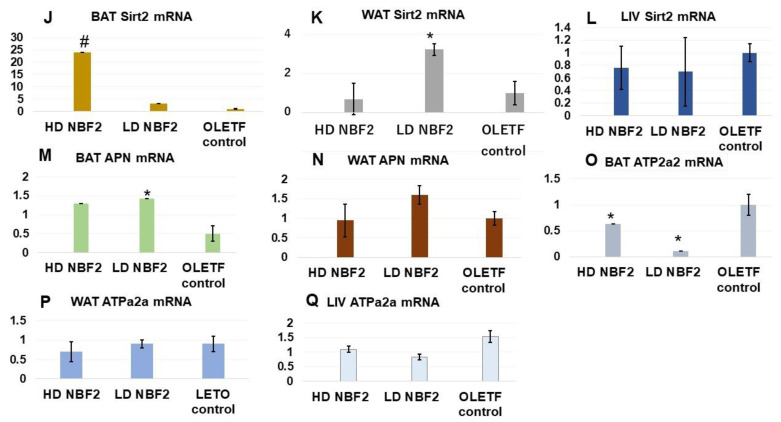
Figure 4.
Messenger RNA (mRNA) gene expression of biomarkers in white/brown adipose tissue and liver biopsies (N = 20). Legend: *, p-value less than 0.05; #, p-value less than 0.01 (vs. OLET control; by Student’s t test); OLETF, Otsuka Long-Evans Tokushima Fatty rats; LETO, Long-Evans Tokushima Otsuka rats; mRNA, messenger ribonucleic acid; BAT, brown adipose tissue; WAT, white adipose tissue; LIV, liver tissue; APN, adiponectin; FASN, fatty acid synthase; PPAR, peroxisome proliferator-activated receptor; Sirt2; sirtuin 2; ATPa2a or SERCA2, ATPase sarcoplasmic/endoplasmic reticulum Ca2+. The unit used is the percentage (%) of the relative mRNA gene expression level for each biomarker.


