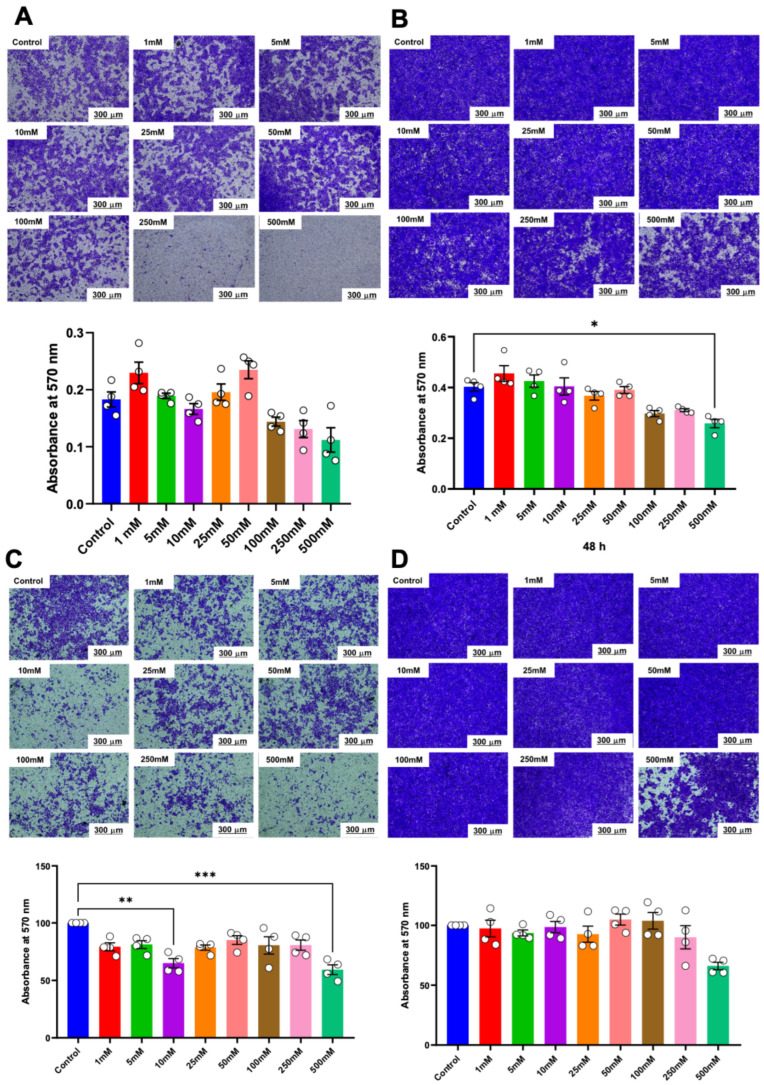
Figure 6.
Invasion assay and quantitative analysis of the percentage of invaded cells. Representative images and quantitative analysis of invaded cells in HSC-4 after 24 h (A) and 48 h (B) of betaine exposure. Representative images and quantitative analysis of invaded cells in HSC-7 after 24 h (C) and 48 h (D) of betaine treatment. A normal culture medium was used as a control. Bar and asterisks indicate a significant difference. Each small circle represents an individual sample. The data are shown in mean ± SE, n = 4.

