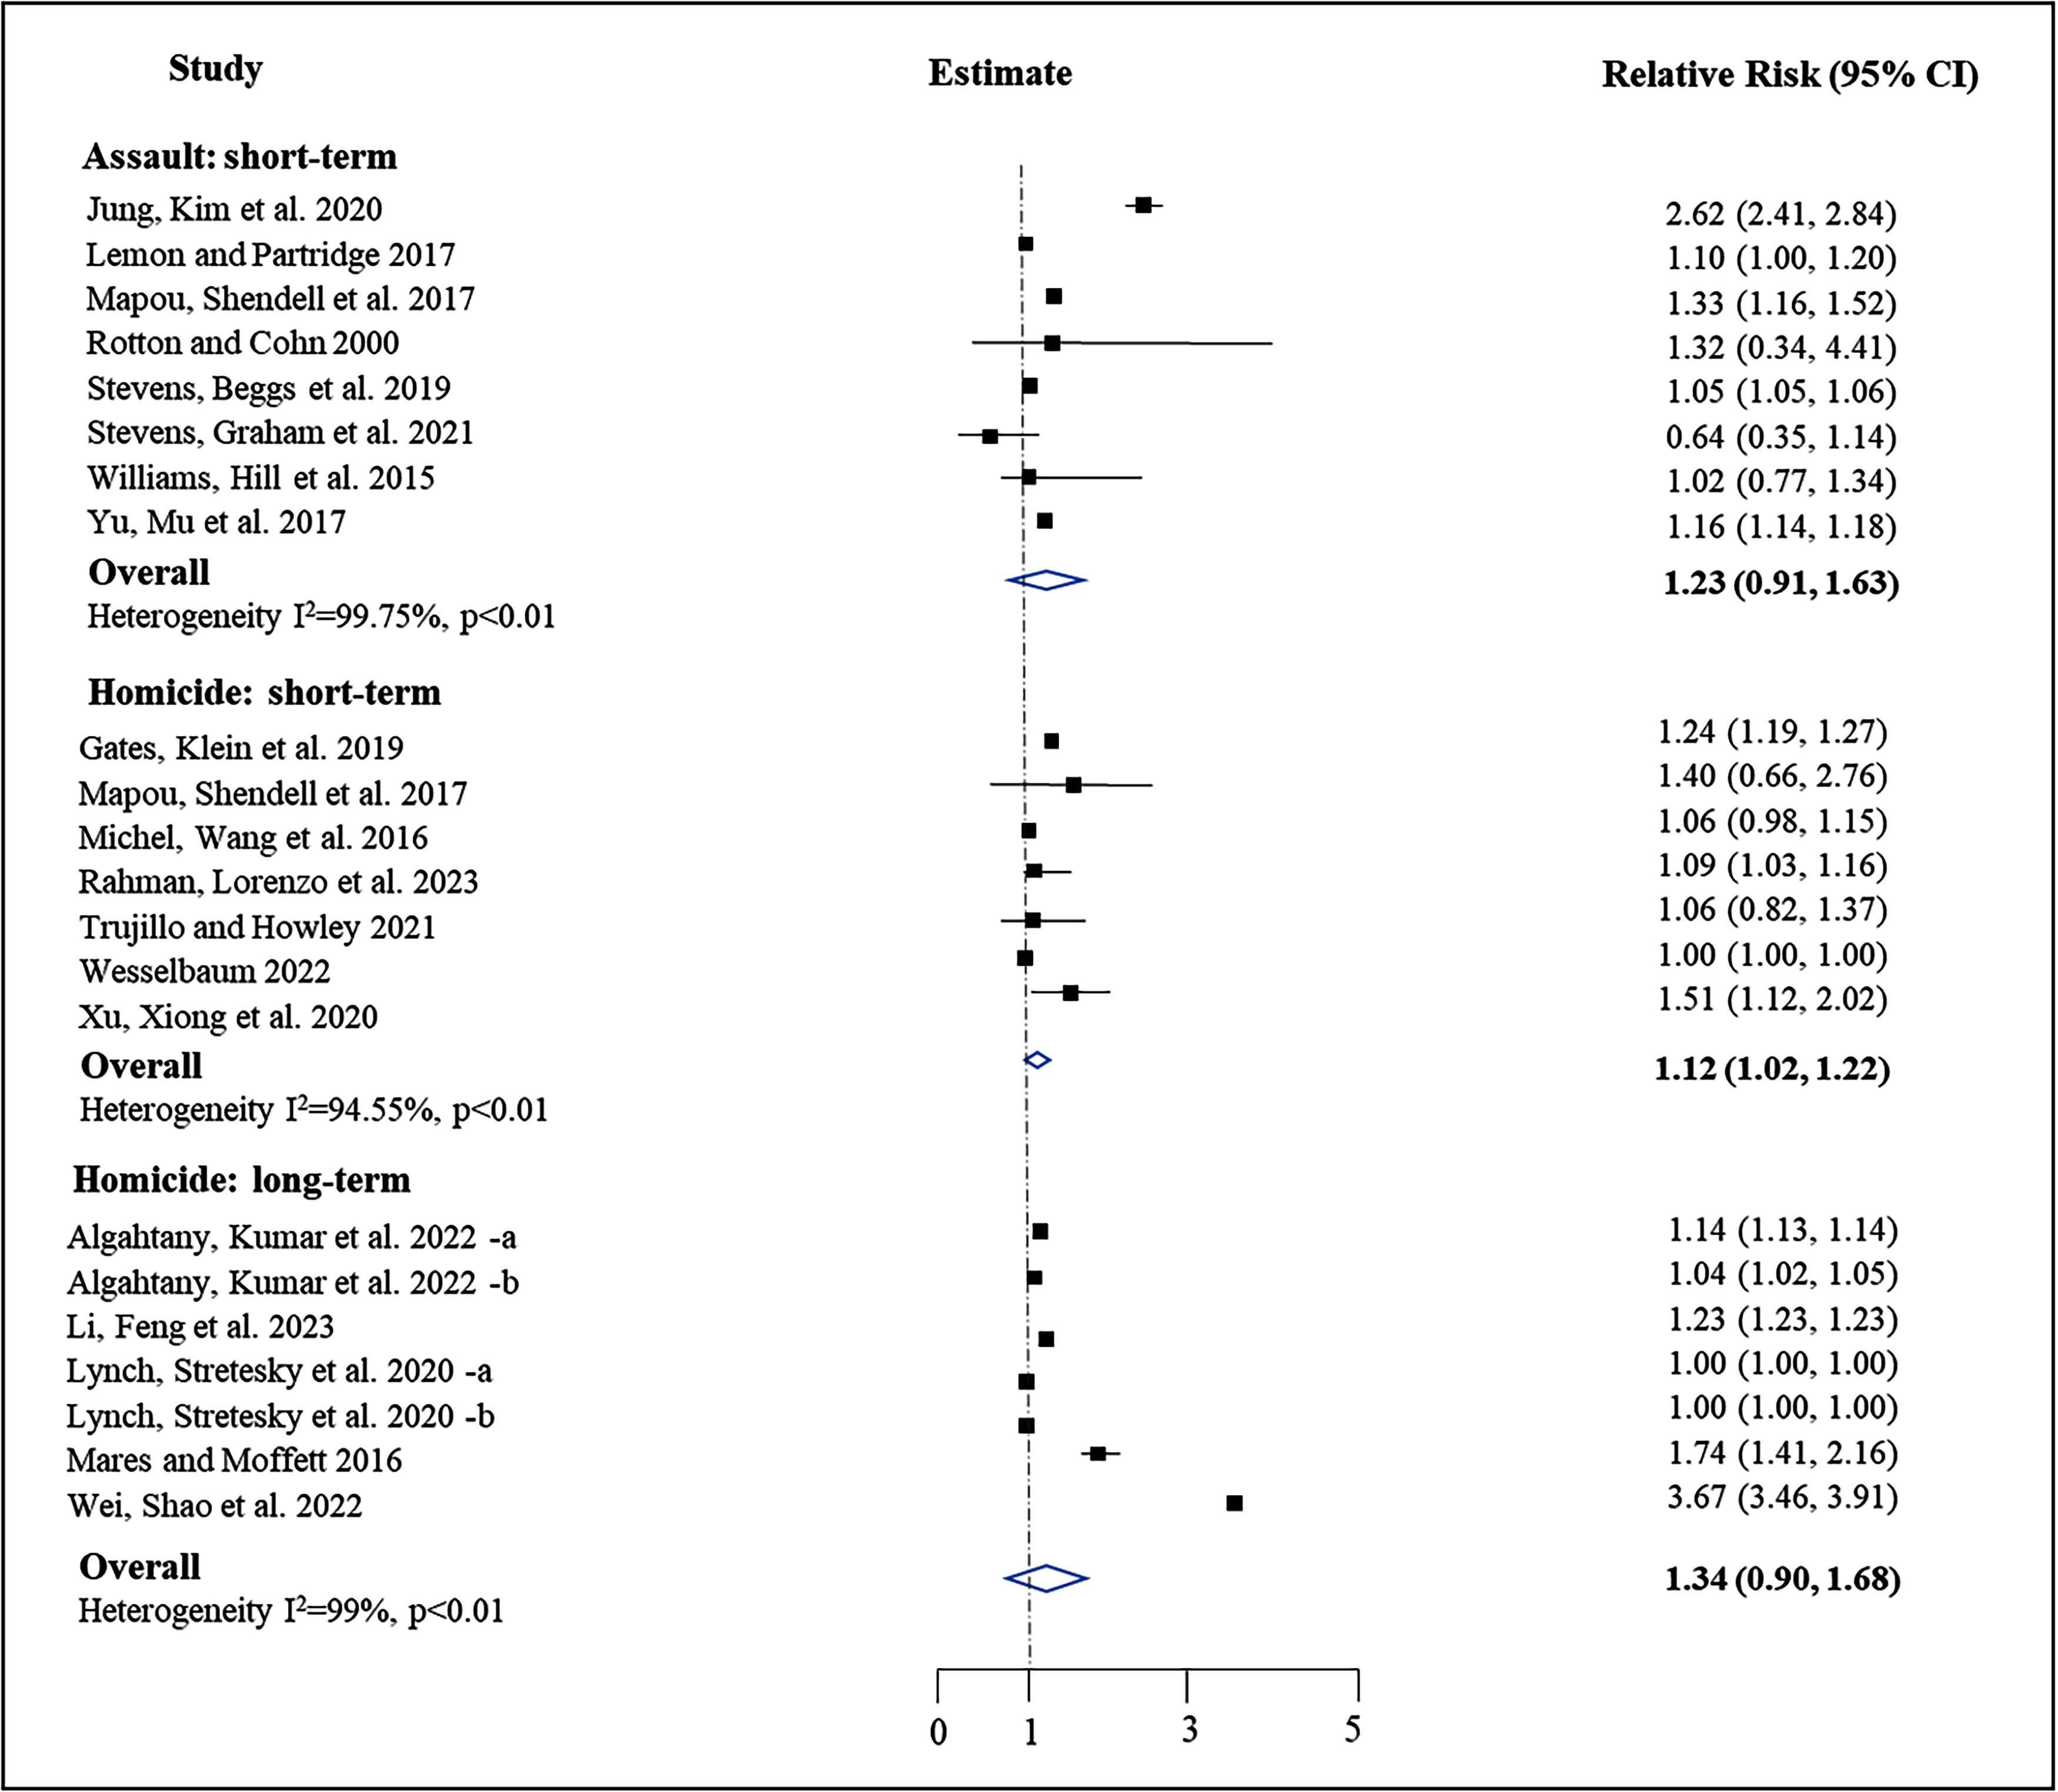
. 2024 Oct 15;132(10):106001. doi: 10.1289/EHP14300

Figure 2.

Figure 2 is a forest plot, plotting Study, ranging as (bottom to top) Overall, including heterogeneity uppercase i squared equals 99 percent, lowercase p less than 0.01; Homicide: Long-term, including Algahtany, Kumar and others 2022 lowercase a; Algahtany, Kumar and others 2022 lowercase b; Li, Feng and others 2023; Lynch, Stretesky and others 2020 lowercase a; Lynch, Stretesky and others 2020 lowercase b; Mares and Moffett 2016; Wei, Shao and others 2022; Overall, including heterogeneity uppercase i squared equals 94.55 percent, lowercase p less than 0.01; Homicide-Short-term, including Gates, Klein and others 2019; Mapou, Shendell and others 2017; Michel, Wang and others 2016; Rahman, Lorenzo and others 2023; Trujillo and Howley 2021; Wesselbaum 2022; Xu, Xiong and others 2020; Overall, including heterogeneity uppercase i squared equals 99.75 percent, lowercase p less than 0.01; and Assault: Short-term, including Jung, Kim and others 2020; Lemon and Patridge 2017; Mapou, Shendell and others 2017; Rotton and Cohn 2000; Stevens, Beggs and others 2019; Stevens, Graham and others 2021; Williams, Hill and others 2015; Yu, Mu and others 2017 (y-axis) across Estimate, ranging from 0 to 1 in unit increments and 1 to 5 in increments of 2 (x-axis) for relative risk (95 percent confidence intervals).

Meta-analysis of studies (n=83) on the association between mean temperature (short-term: daily or weekly scale exposure and long-term: monthly or yearly scale exposure) and assault and homicide. Crime or violence risk for 10°C (18°F) increase.