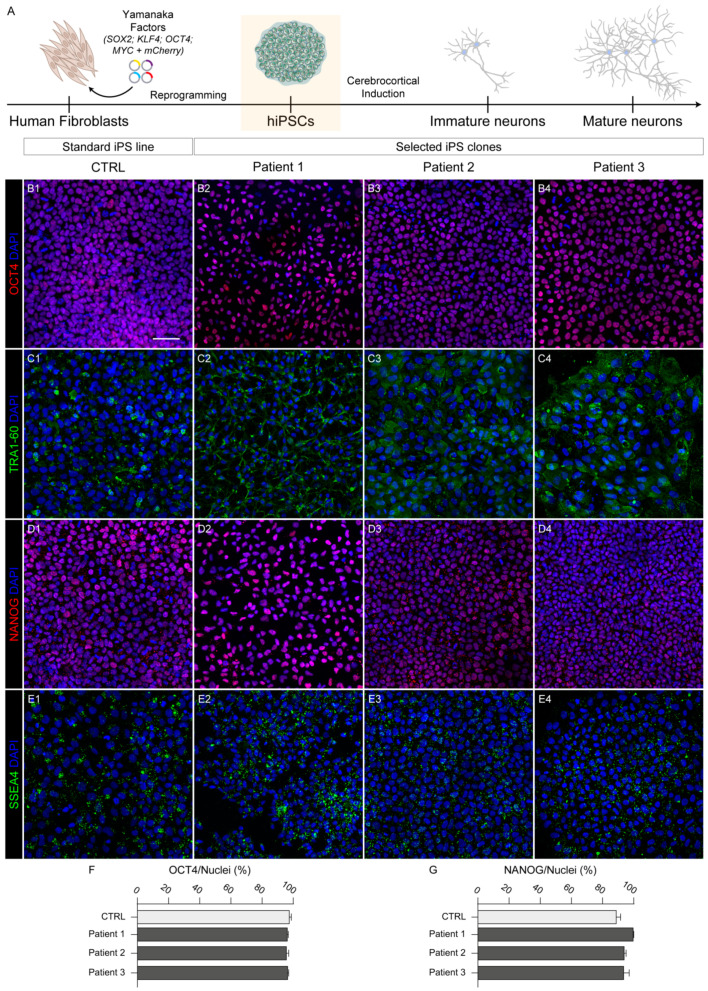
Figure 1.
Generation of HPDL mutant hiPS cell lines deriving from three SPG83 patients. (A) Schematic representation of workflow starting from human fibroblasts reprogrammed into hiPS cells, and then cortically induced in neurons. (B1–B4, C1–C4, D1–D4, E1–E4) Representative confocal images with stemness markers OCT4, TRA-1-60, NANOG, and SSEA4, respectively, in CTRL and HPDL hiPS cells. All nuclei were stained with DAPI. Scale bar: 50 μm. (F) Bar plot indicating the ratio of OCT4-positive cells on total nuclei in CTRL and HPDL cell lines (counted cells: CTRL, N = 1892; Patient 1, N = 778; Patient 2, N = 971; Patient 3, N = 984). (G) Bar plot indicating the ratio of NANOG-positive cells on total nuclei in CTRL and HPDL cell lines (counted cells: CTRL, N = 1807; Patient 1, N = 864; Patient 2, N = 1481; Patient 3, N = 1766).

