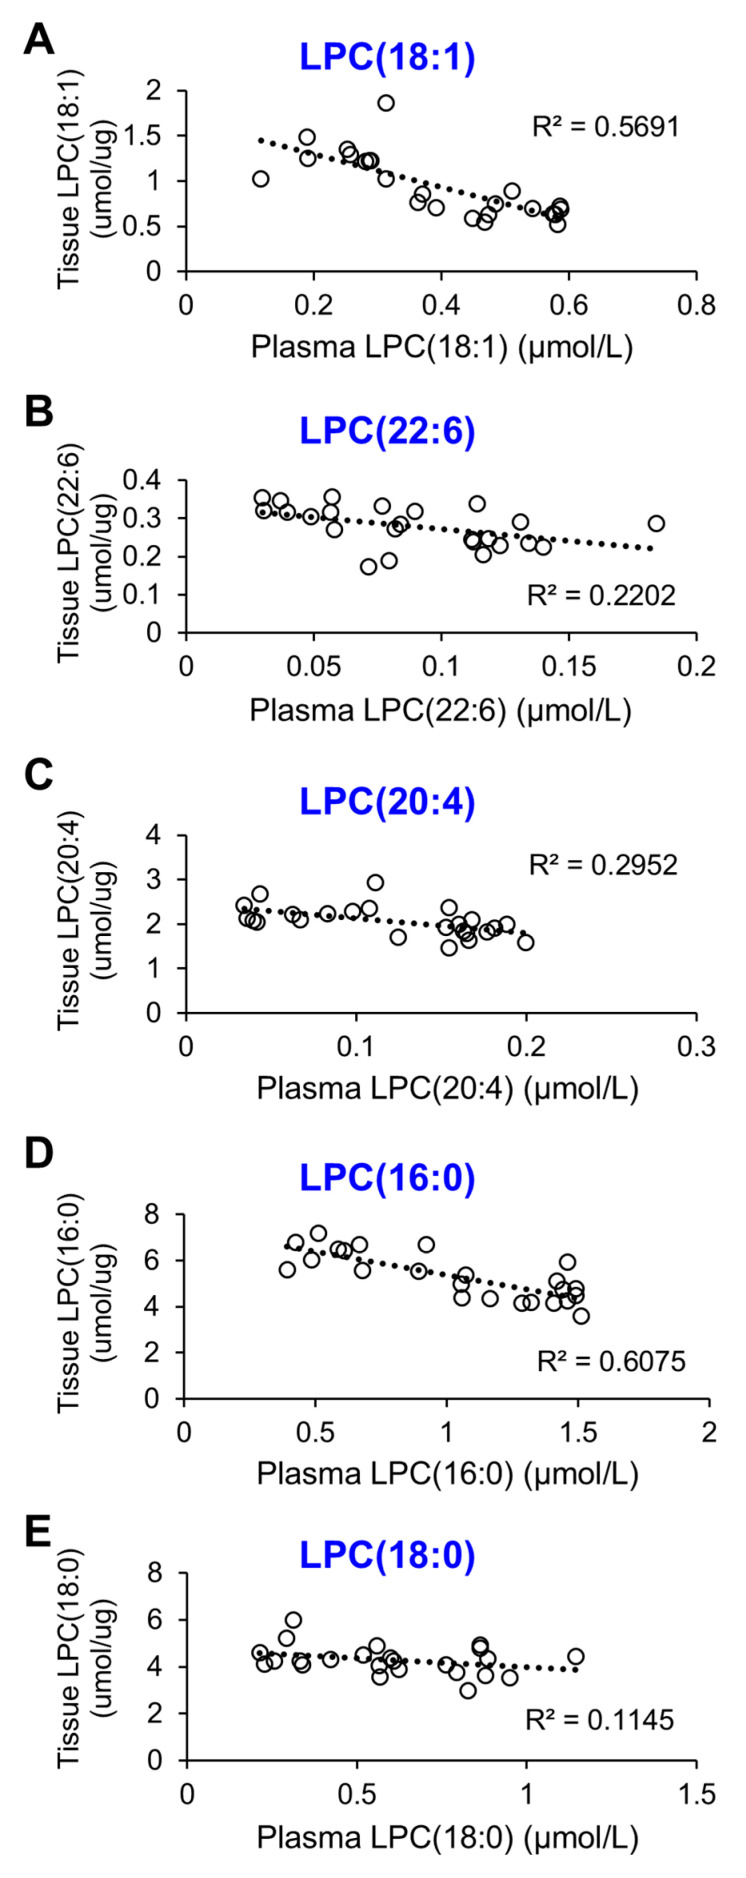
Figure 5.
Plasma LPC levels display a negative correlation with brain LPC levels across all five species, with an increase in brain LPC corresponding to a decrease in plasma LPC. Notably, LPC(18:1) and LPC(16:0) are the only species that exhibit a strong correlation across all LPC species. (A) LPC(18:1). (B) LPC(22:6). (C) LPC(20:4). (D) LPC(16:0). (E) LPC(18:0).

