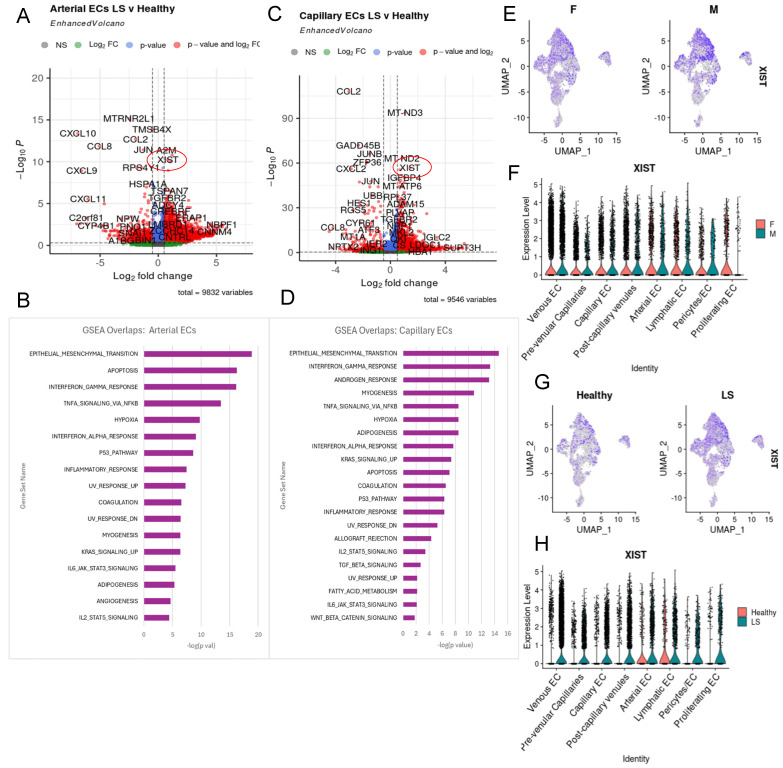
Figure 5.
XIST in LS endothelial cells. (A) Volcano plot showing the top LS vs. healthy DEGs for the arterial cluster. (B) Top 20 GSEA pathway overlaps ranked by p-value based on the top 200 upregulated DEGs in the arterial LS. (C) Volcano plot showing the top LS vs. healthy DEGs for the capillary cluster. (D) Top 20 GSEA pathway overlaps when run on the top 200 upregulated DEGs in LS capillary DEGs. (E,F) Displays the proportion of male vs. female cells that express in endothelial cells in a feature plot and a volcano plot respectively. (G) Shows the expression of XIST via feature plot in our endothelial cell subset split by health. (H) Shows a volcano plot of XIST expression per cluster in our endothelial cell subset split by health with clear prominence in LS cells.

