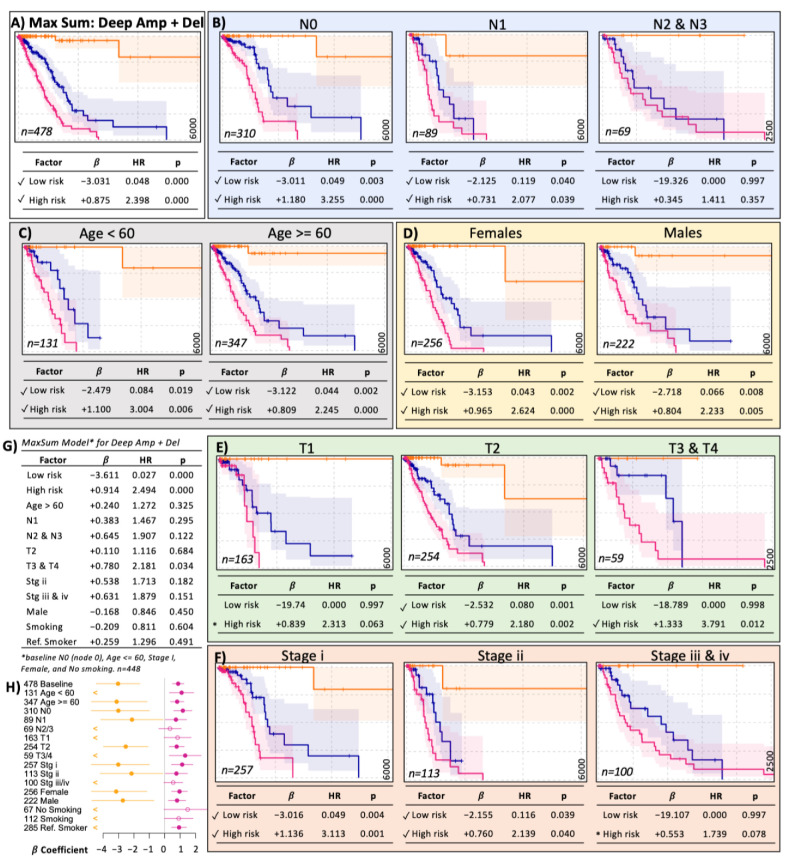
Figure 5.
The MaxSum model for deep amplifications and deletions in lung adenocarcinoma (LUAD). (A) The LUAD model for deep CNA considers deep amplification and deletions for all patients (n = 478). Stratification of the model by nodules (B), age (C), sex (D), tumor size (E), and tumor stage (F). Most models show significant risk groups. (G) Multivariate statistical analysis of the model in (A) including common clinical cofactors. (H) Summary of the stratifications as a forest plot. The numbers on the left represent the sample size (n). Dots represent the β-coefficient estimation, closed for significant and open for not significant. Lines represent a 95% confidence interval. “<” refers to the lack of estimation in low-risk groups. A tick mark highlights significant risk estimation. “*” marks marginally significant risk groups. The frame colors group panels for clarity only. The vertical axis of survival curves ranges from 0 in bottom to 1 in top and horizontally from 0 in the left to 6000 days in the right except N2 & N3, T3 & T4, Stage iii & iv which are 2500 days.

