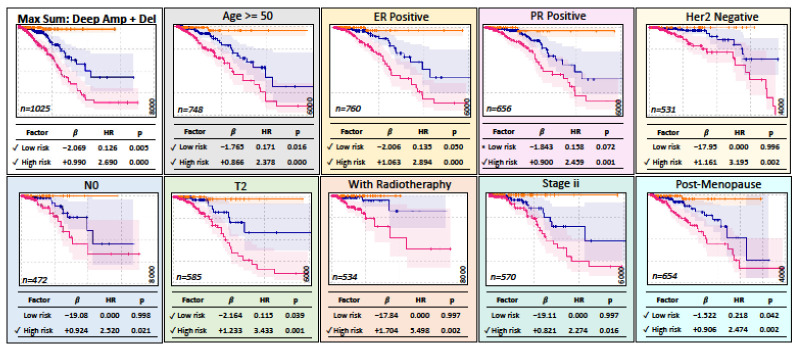
Figure 7.
The MaxSum model for deep CNA with amplifications and deletions in breast carcinoma (BRCA). The top-left panel shows the model with all patients. The additional panels show the largest subpopulation within each clinical factor. A tick mark highlights a significant risk estimation. The frame colors are used for clarity only. The vertical axis of survival curves ranges from 0 in bottom to 1 in top and horizontally from 0 in the left to 4000, 6000, or 8000 days in the right as specified in right corner in each panel.

