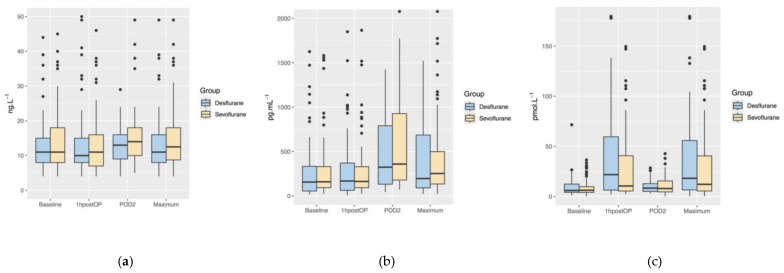
Figure 2.
Boxplots showing the perioperative time course and postoperative maximum concentrations of troponin T (a), NT-proBNP (b), and copeptin (c) separately for the desflurane group (blue) and the sevoflurane group (yellow). Boxplots demonstrate medians and interquartile ranges, dots represent outliers. 1hpostOP, within one hour after surgery; POD2, postoperative day 2.

