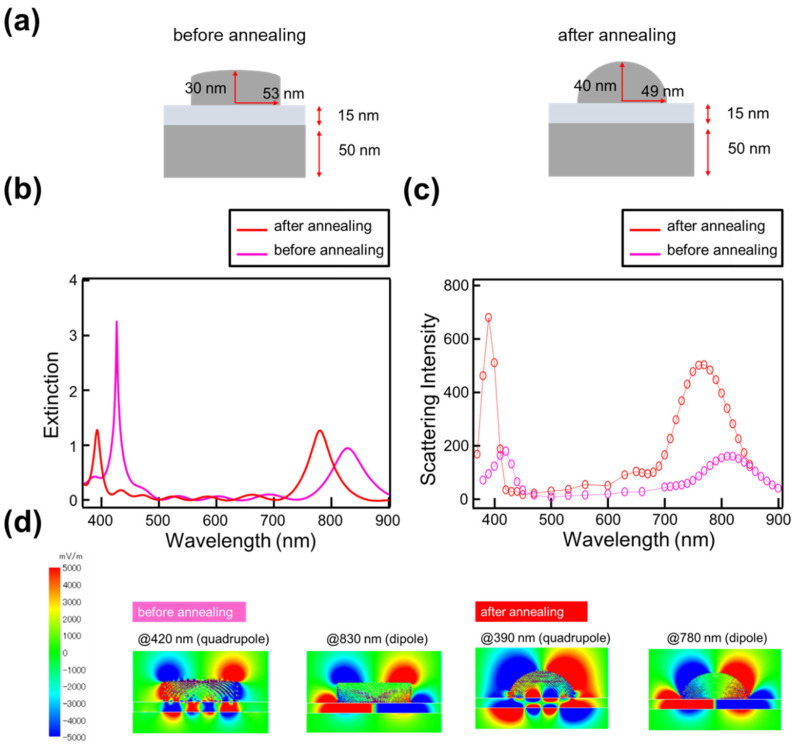
Figure 7.
(a) Shape changes before and after annealing, (b) extinction changes, and (c) scattering intensity changes associated with these shape changes. The circles in the figure show the calculated scattering intensity at each wavelength. (d) Electric field distribution before and after annealing in the wavelength region where both the short- and long-wavelength peaks are observed.

