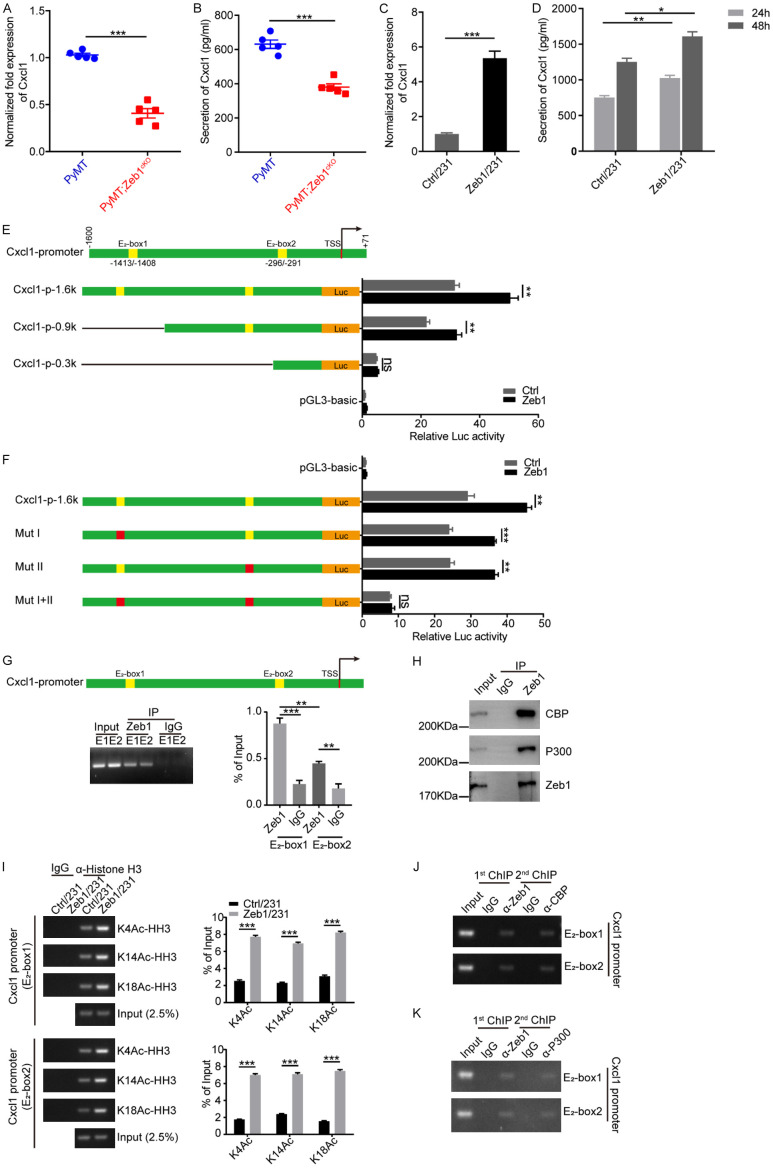
Figure 2.
Zeb1 transcriptionally activates Cxcl1. (A) Relative mRNA levels of Cxcl1 in breast cancer tissues (n = 5 for both the PyMT group and the PyMT;Zeb1cKO group). (B) Analysis of the Cxcl1 concentration in CM by ELISA (n = 5 for both the PyMT group and the PyMT;Zeb1cKO group). (C) Relative mRNA levels of Cxcl1 in Zeb1-expressing MDA-MB-231 cells. (D) Analysis of the Cxcl1 concentration in CM from Zeb1-expressing MDA-MB-231 cells via ELISA. (E) Luciferase assays of the wild-type (-1600/+71) and truncated Cxcl1 promoters in Zeb1-expressing MDA-MB-231 cells. (F) Luciferase assays of the wild-type Cxcl1 promoter (-1600/+71) and E2 box element-mutated Cxcl1 promoters in Zeb1-expressing MDA-MB-231 cells. (G) ChIP assays showing the recruitment of Zeb1 to E2 box elements in the endogenous Cxcl1 promoter in MDA-MB-231 cells. (H) Co-IP analysis of the interaction between ZEB1 and P300 or CBP in MDA-MB-231 cells. (I) ChIP assays showing the recruitment of K4-, K14- and K18-acetylated α-histone H3 to E2-box elements in the endogenous Cxcl1 promoter in Zeb1-expressing MDA-MB-231 cells. (J, K) ChIP-on-ChIP analysis showing the co-occupation of E2-box elements in the endogenous Cxcl1 promoter by Zeb1 with either CBP (J) or P300 (K) in MDA-MB-231 cells. The indicated P values were calculated using two-tailed unpaired Student’s t-tests. The data are presented as the mean ± SEM in (A, B). The dots represent individual samples in (A, B). The data are representative of five (A, B) or three (C-K) independent experiments. Source data are provided as a source data file.

