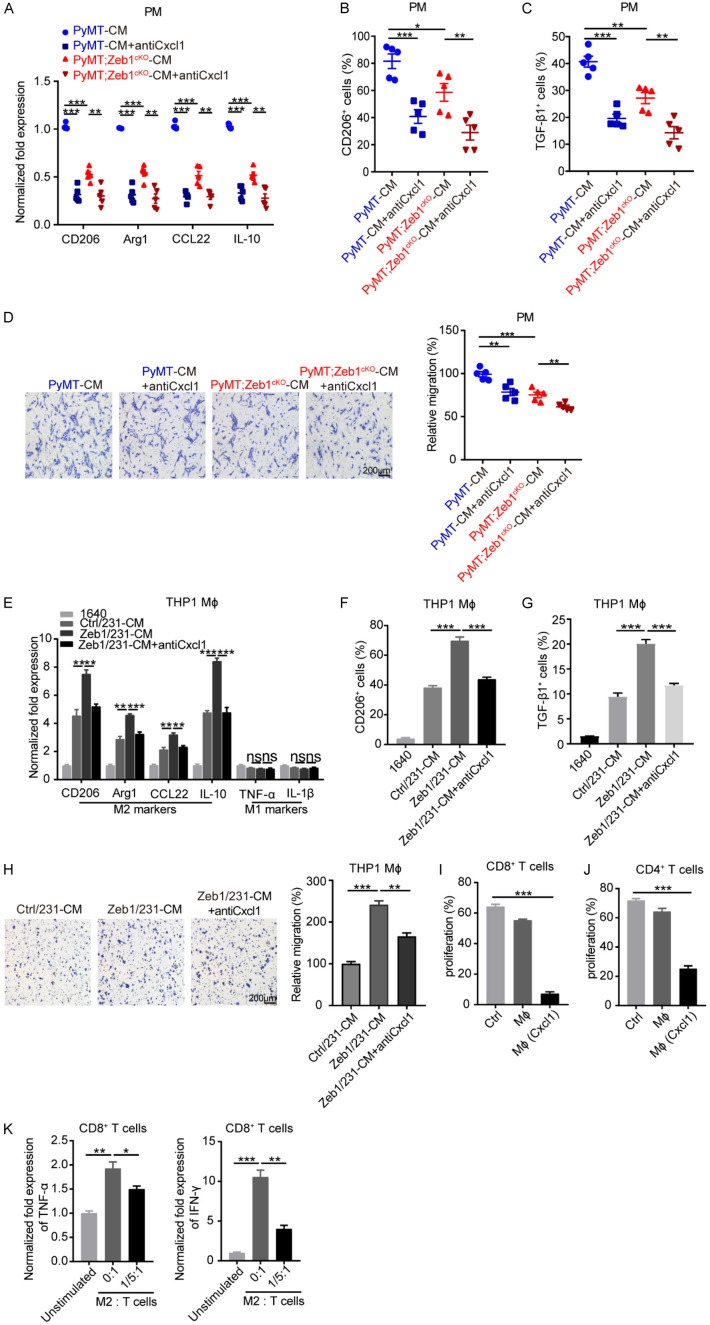
Figure 3.
Zeb1-induced Cxcl1 production contributes to M2-like TAM polarization. (A) Relative mRNA levels of M2-TAM markers in peritoneal macrophages treated with CM from primary cancer cells in the presence of a Cxcl1-neutralizing antibody (n = 5 for both the PyMT group and the PyMT;Zeb1cKO group). (B, C) Flow cytometry analysis of CD206+ (B) and TGF-β1+ (C) cells in peritoneal macrophages treated with CM from primary cancer cells in the presence of a Cxcl1-neutralizing antibody (n = 5 for both the PyMT group and the PyMT;Zeb1cKO group). (D) Transwell assay analysis of the migration of peritoneal macrophages treated with CM from primary cancer cells in the presence of a Cxcl1-neutralizing antibody (n = 5 for both the PyMT group and the PyMT;Zeb1cKO group). (E) Relative mRNA levels of M1- and M2-TAM markers in THP1 macrophages treated with CM from Zeb1-expressing MDA-MB-231 cells in the presence of a Cxcl1-neutralizing antibody. (F, G) Flow cytometry analysis of CD206+ (F) and TGF-β1+ (G) THP1 macrophages treated with CM from Zeb1-expressing MDA-MB-231 cells in the presence of a Cxcl1-neutralizing antibody. (H) Analysis of the migration of THP1 macrophages treated with CM from Zeb1-expressing MDA-MB-231 cells in the presence of a Cxcl1-neutralizing antibody via the Transwell assay. (I, J) Flow cytometry analysis of CFSE+ cells among CD8+ (I) and CD4+ (J) T cells co-cultured with peritoneal macrophages treated with rmCxcl1. (K) Relative mRNA levels of TNF-α and IFN-γ in CD8+ T cells co-cultured with peritoneal macrophages treated with rmCxcl1. The indicated P values were calculated using two-tailed unpaired Student’s t-tests. The data are presented as the mean ± SEM in (A-H). The dots represent individual samples in (A-D). The data are representative of five (A-D) or three (E-K) independent experiments. Source data are provided as a source data file.

