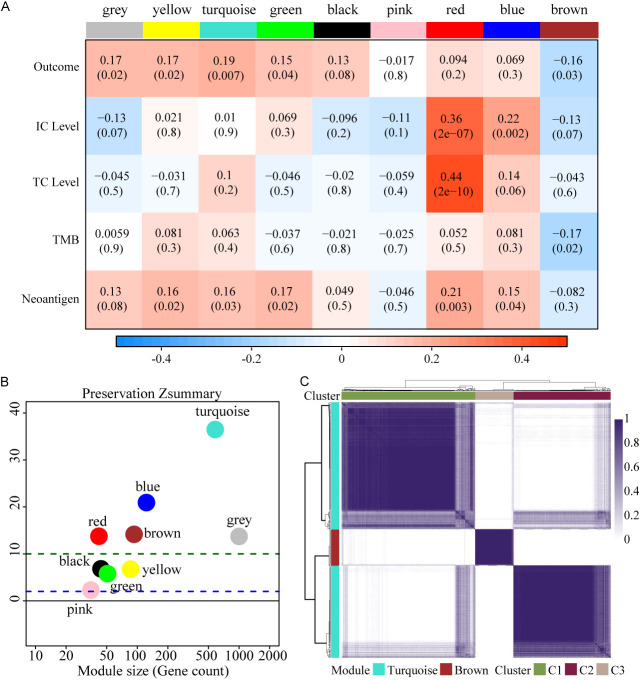
Figure 1.
Expression patterns of gene modules in bladder cancer. A. 8 co-expressed modules were identified. While the “grey” module was reserved for genes identified as not co-expressed. Each row to a feature related to immunotherapy. Each cell contains the correlation and the P-value. The table is color-coded by correlation according to the color legend. B. The Z-summary statistics of the module preservation, the dashed blue and green lines indicate the thresholds Z=2 and Z=10, respectively. These horizontal lines indicate the Z-summary thresholds for strong evidence of conservation (above 10) and for low to moderate evidence of conservation (above 2). C. Consensus clustering solution (k=3) for turquoise and brown module genes in IMvigor210 cohort (n=192).

