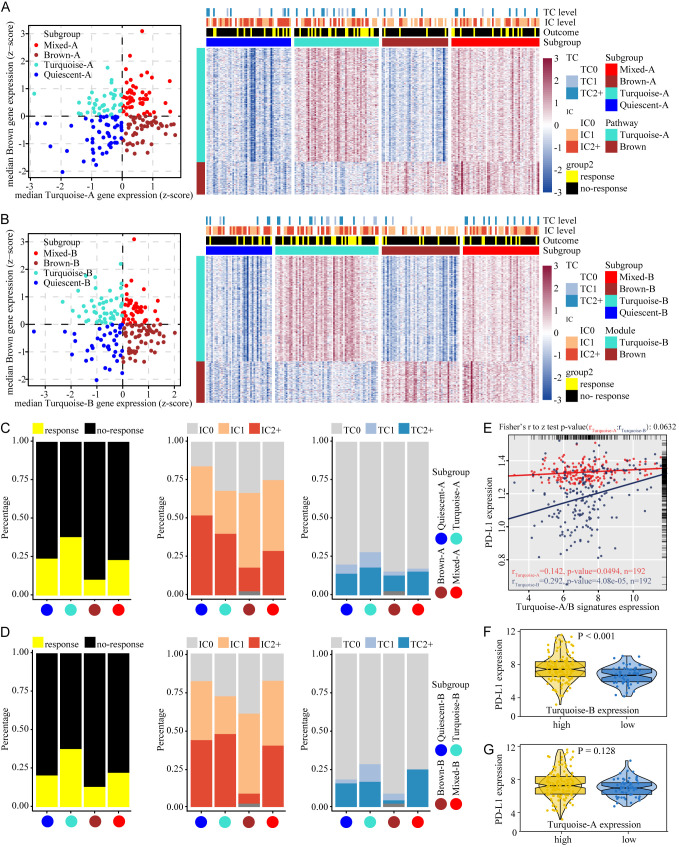
Figure 2.
Tumor stratification reveals the relationship between ICBT signature and PD-L1 expression. (A) Stratification of tumors based on expression of turquoise-A and brown signature genes. (B) Stratification of tumors based on turquoise-B and brown signature genes. Scatter plot showing median expression levels of turquoise (A or B) and brown signature genes in each tumor sample. Corresponding subgroups were assigned on the basis of the relative expression levels of signature genes. Heatmap depict expression levels of signature genes in each subgroup. (C) The proportion of patients responding to ICBT and the proportion of different IC and TC levels when used turquoise-A and brown signature genes to identify subgroup. (D) The proportion of features when used turquoise-B and brown signature genes to identify subgroup. (E) Correlations between signatures and PD-L1 expression. Red represent turquoise-A signature, blue for turquoise-B signature. (F) PD-L1 expression in high or low expression of turquoise-B signature. (G) PD-L1 expression in high or low expression of turquoise-A signature. ICBT, immune checkpoint blockade therapy; PD-L1, programmed cell death ligand-1; IC, immune cells; TC, tumor cells.

