Figure 5.
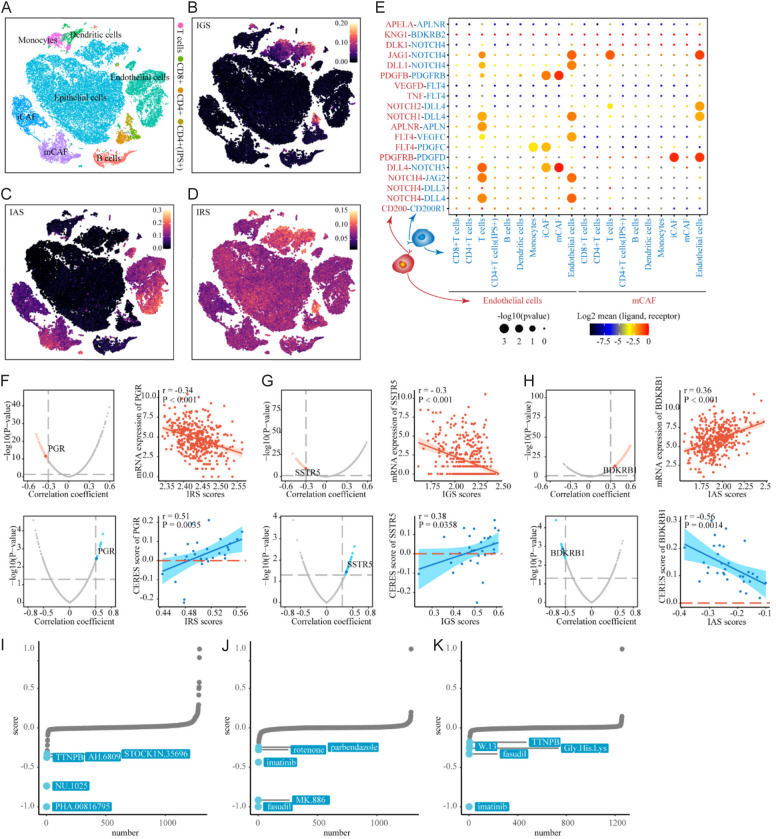
Expression pattern of ICBT signatures among cells in tumor microenvironment and identification of ICBT signatures-related drug targets. (A) tSNE plot of single cells profiled in the presenting study colored by major cell types. (B-D) tSNE plot of the expression pattern of IGS in the single cells profiled (B); IAS in the single cells profiled (C); IRS in the single cells profiled (D). (E) Bubble plots show ligand-receptor pairs of genes from IAS between clusters with activated IAS and other immune cell groups; (F) Red volcano plot (left) and scatter plots (right) of Spearman’s correlations and significance between IRS score and mRNA expression of drug targets. Red dots indicate the significant positive correlations (P<0.05, and Spearman’s r absolute value >0.3). Blue volcano plot (left) and scatter plots (right) of Spearman’s correlations and significance between IRS score and CERES score of drug targets. Blue dots indicate the significant negative correlations (P<0.05, and Spearman’s r absolute value >0.3); (G) IGS; (H) IAS; (I) CMap analysis of IRS, the lower the score of compounds, the more likely the drug is to reverse the molecular characteristics of the disease; (J) CMap analysis of IGS; (K) CMap analysis of IAS. ICBT, immune checkpoint blockade therapy; IRS, ICBT RNA regulatory signature; IGS, ICBT genomic stability signature; IAS, ICBT angiogenesis signature.

