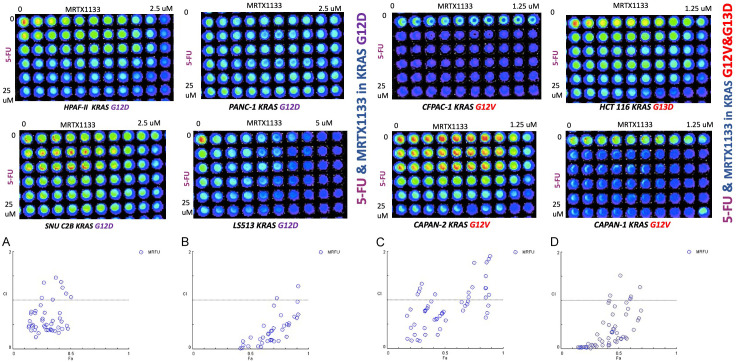
Figure 2.
Synergy between 5-FU and MRTX1133 observed in KRAS G12V, KRAS G13D and KRAS G12D but not in KRAS WT CRC or PDAC cell lines, independent of KRAS mutation subtype. The graphic representations obtained from the CompuSyn Report using Chou-Talalay Method, the graph y axis shows Combination index range 0-2 (less than 1 considered synergy) and X axis is Fa Fraction affected. For the combination index, CI < 1, CI = 1, and CI > 1 represent synergism, additive effect, and antagonism, respectively. The Fa value represents the effect of the drug, that is, the tumour cell inhibition rate. Strong synergy was observed between 5-FU and MRTX1133 in both KRAS G12V and KRAS G12D cell lines. Combination index ranges from 0.1-0.8. (A) CI in LS513 (KRAS G12D), (B) CI in SNUC2B (KRAS G12D), (C) CI in Capan-2 (KRAS G12V), (D) CI in HCT-116 (KRAS G13D) E&F, 72 hours cell viability assay used in cells with KRAS G12V & KRAS G12 D to determine the synergy. CI < 1 reflects drug synergy.

