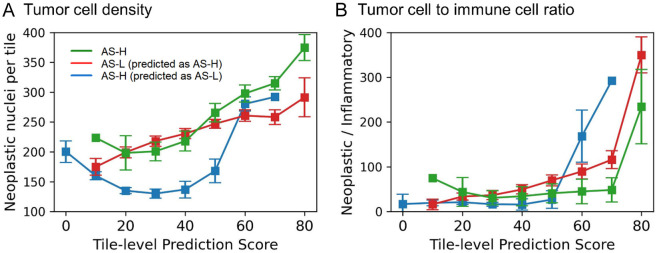
Figure 2.
Influence of tumor cell density and tumor cell to immune cell ratio in tile-level AS prediction. A: Tumor cell density of three cases representing AS-H (green line), AS-L incorrectly predicted as AS-H (red line), and AS-H incorrectly predicted as AS-L (blue line), each aligned with the prediction scores of their respective tiles (0-80%). B: Ratio between tumor cells and immune cells. Three cases are displayed according to tile-level prediction scores. AS-H, high aneuploidy score; AS-L, low aneuploidy score.

