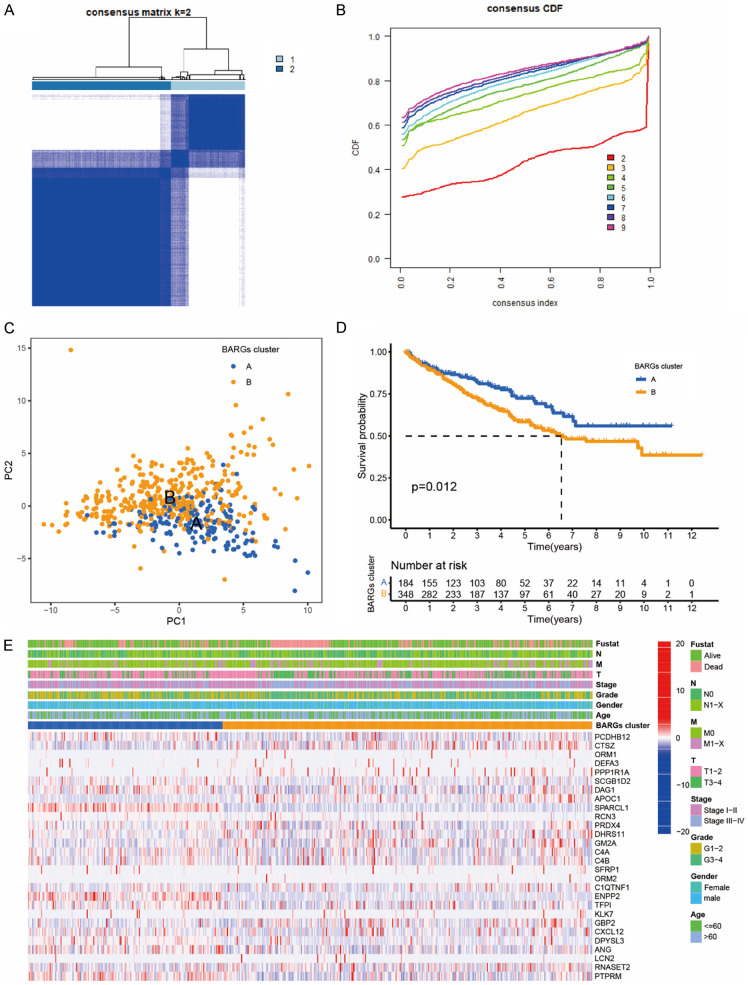
Figure 2.
Clinicopathological characteristics and survival of ccRCC patients in 2 BARGs clusters. A. All samples from the TCGA-KIRC cohort were divided into 2 clusters using a consensus clustering algorithm (k = 2). B. The cumulative distribution function (CDF) for k = 2 to 9. C. Principal component analysis (PCA) analyses of patients in 2 BARGs clusters. D. Kaplan-Meier curves show the different overall survival (OS) rates between the 2 BARGs clusters. E. Heatmap shows different clinicopathologic features between the two clusters.

