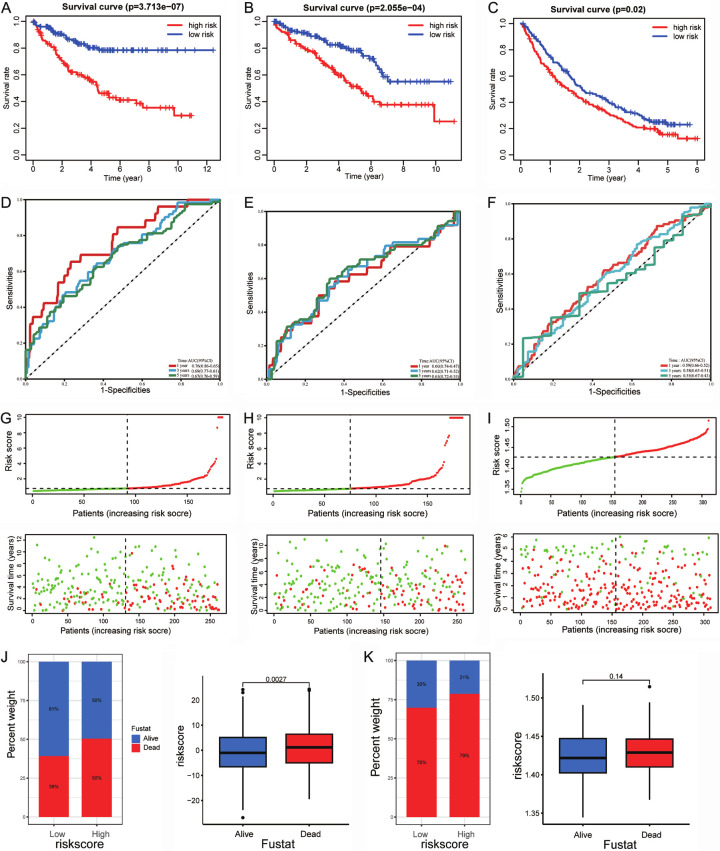
Figure 5.
Validation of the prognostic signature for ccRCC patients. Kaplan-Meier curves show OS differences stratified by the risk score in the training cohort (A), vivo validation cohort (B) and vitro validation cohort (C). ROC curves of the signature for overall survival rates at 1, 3, and 5 years in the training cohort (D), vivo validation cohort (E) and vitro validation cohort (F). Distribution of the risk score and overall survival in the training cohort (G), vivo validation cohort (H) and vitro validation cohort (I). Relationship between risk score and survival status in (J) TCGA-KIRC cohort and (K) USA-ccRCC cohort.

