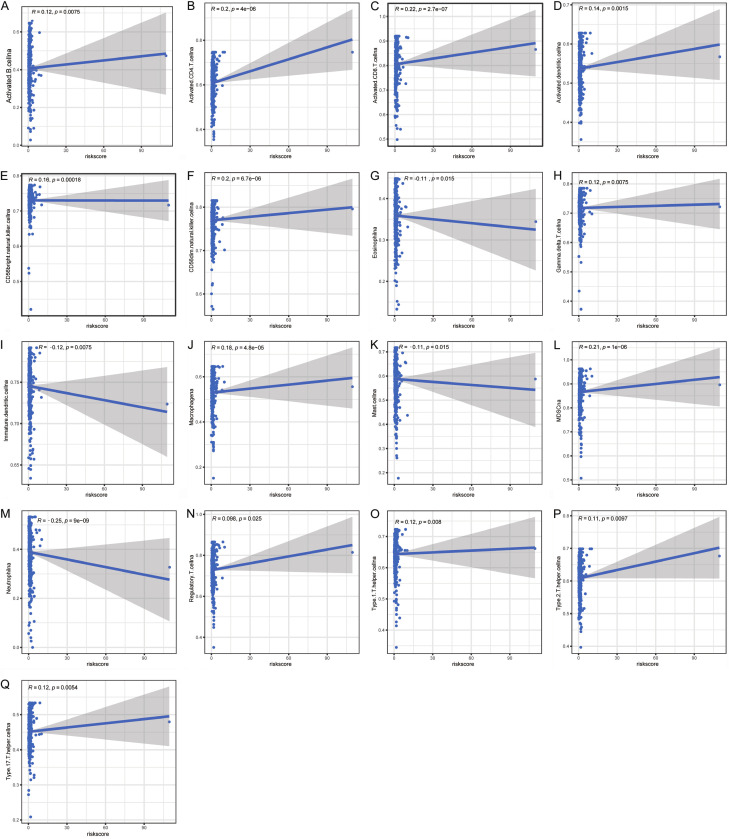
Figure 6.
Correlation of immune cell infiltrates with the risk score in ccRCC. (A) activated B cell, (B) CD4+ T cells, (C) CD8+ T, (D) activated dendritic cell, (E) CD56bright NK cell, (F) CD56dim NK cell, (G) eosinophil, (H) γδ T cell, (I) iDC, (J) macrophage cell, (K) mast cell, (L) MDSC, (M) neutrophil, (N) Treg cell, (O) Th1 cell, (P) Th2 cell, and (Q) Th17 cell.

