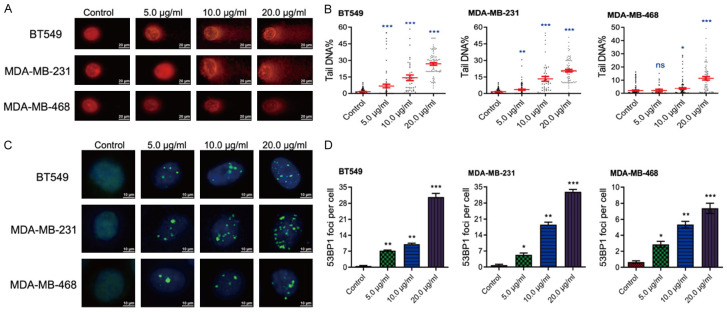
Figure 3.
LBR treatment induces DNA damage and DNA damage response in TNBC cells. A, B. Comet assay exhibiting nuclear staining image of the broken DNA tail distance for quantitative detection of DNA damage upon LBR treatment (n = 15). C, D. Immunofluorescence assay was used to show the 53BP1 foci in TNBC cells treated with indicated concentration of LBR. Quantification of the 53BP1 foci per cell was calculated.

