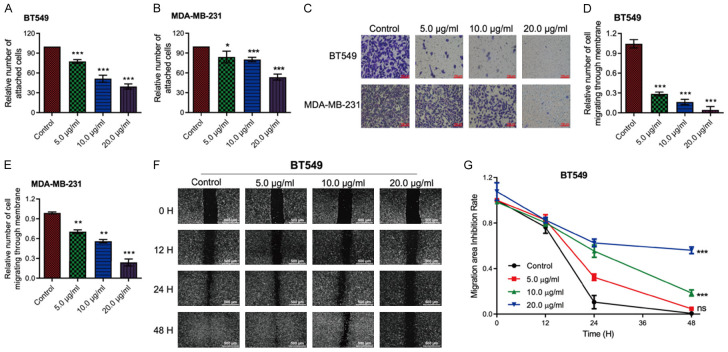
Figure 4.
L. bicolor root components (LBR) suppress invasion and migration of TNBC cells. A, B. Cell adhesion assays were performed on BT549 and MDA-MB-231 cells. C. Transwell assays were used to analyze the invasion of BT549 and MDA-MB-231 cells. D, E. Quantification of cell invasion. F. The inhibition effect of BT549 cell migration was detected by scratch assay at 0 h, 12 h, 24 h, and 48 h. G. Quantification of BT549 cell migration. Data are displayed as mean ± standard deviation (SD) (n = 3), *P < 0.05 or **P < 0.01.

