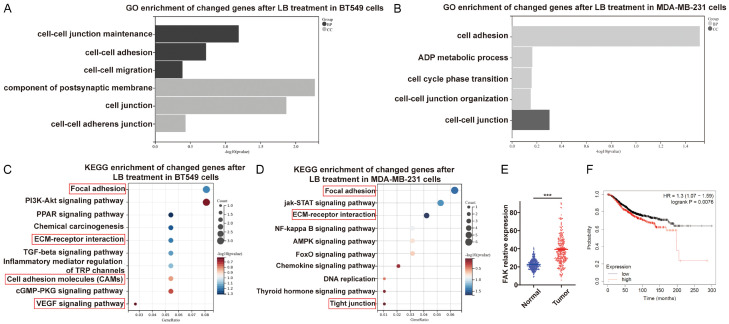
Figure 5.
Exploration of potential mechanisms of L. bicolor root components (LBR) in TNBC cells via RNA-Seq network analysis. A, C. Top biological process (BP) and cellular component (CC) in Gene Ontology (GO) analysis for BT549 and MDA-MB-231 cells. Item ranking based on p-value. B, D. Bubble diagram of Kyoto Encyclopedia of Genes and Genomes (KEGG) enrichment analysis for potential signaling pathways in LBR-treated BT549 and MDA-MB-231 cells. The bubble size indicates the pathway target number. The bubble color represents the p-value magnitude, with a redder hue indicating a smaller p-value and higher enrichment degree. E. Expression levels of focal adhesion kinase (FAK) in TNBC versus non-cancerous tissues. F. Overall survival analysis of FAK in TNBC.

