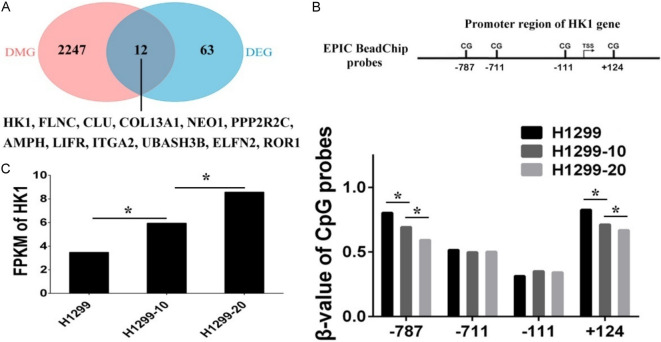
Figure 3.
Integrated DNA methylation and gene expression analysis. A. Venn diagram showing the overlap between differentially methylated genes (DMG) and differentially expressed genes (DEG). B. The β-values of Illumina Methylation EPIC BeadChip probes mapping to the promoter regions of HK1 gene in H1299, H1299-10, and H1299-20 cells. C. The fragments per kilobase of exon per million reads mapped (FPKM) values of HK1 gene in H1299, H1299-10, and H1299-20 cells (*P < 0.05).

