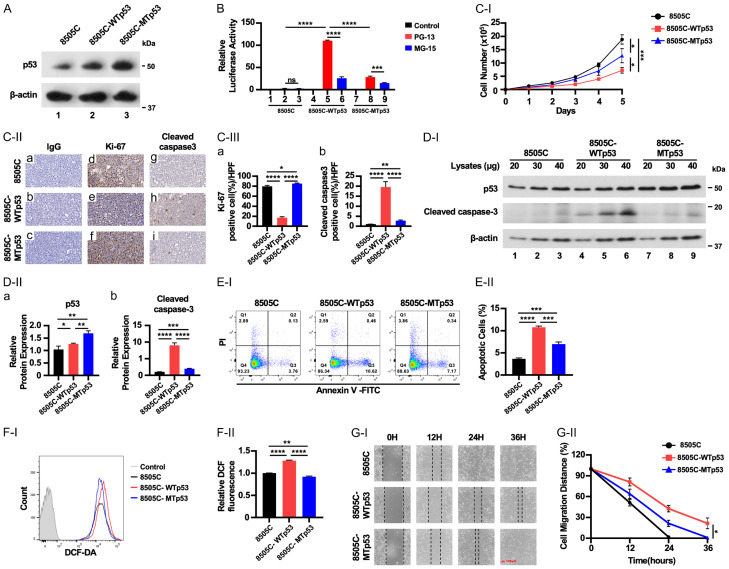
Figure 1.
Exogenously expressed WTp53 inhibits cell growth of ATC cells. (A) Representative western blots showing p53 protein levels in 8505C, 8505C-WTp53, 8505C-MTp53 cells. (B) WTp53, but not MTp53, activated the luciferase activity mediated by WTp53 cis elements (PG13), but not mutated cis-elements (MG-13). Significant differences are indicated by asterisks (****P<0.0001). Data represent the mean ± SD (n=3). (C-I) Cell proliferation curves for 8505C, 8505C-WTp53, 8505C-MTp53 cells, respectively. Cells were seeded in six-well plates at a density of 50,000 cells per well and counted daily for 5 days. (C-II) Cells were expanded for 3-7 days before pelleting for IHC analysis. Representative IHC images and quantitative analysis of IHC results for Ki-67 (d-f) and cleaved caspase-3 (g-i). (C-III) Cell stained positively with Ki-67 (a) or cleaved caspase 3 were counted and graphed (n=3). Significant differences are indicated by asterisks ****P<0.0001. Data represent the mean ± SD (n=3). (D) Representative western blot analysis showing high expression of WTp53 and cleaved caspase-3 proteins in ATC cells (n=3). (E) Elevated WTp53 proteins in ATC cells increases apoptotic cell death. (E-II) Quantitative analysis of apoptotic cells (n=3) in 8505C, 8505C-WTp53, and 8505C-MTp53 cells. (F-I) Elevated WTp53 protein increases reactive oxygen species (ROS) in ATC cells analyzed by flow cytometry analysis. (F-II) Quantitative analysis of ROS (n=3) in 8505C, 8505C-WTp53, and 8505C-MTp53 cells. (G-I) WTp53, inhibits cell migration of ATC cells. (G-II) Quantitative analysis of migration distances from the wound scratch sites. Cell migration capacity was analyzed for 8505C, 8505C-WTp53, and 8505C-MTp53 cells, respectively. Scale bar (red bar) =100 µm. Significant differences are indicated by asterisks (*P<0.05, **P<0.01, ***P<0.001, and ****P<0.0001). Data represent the mean ± SD (n=3).

