Figure 3.
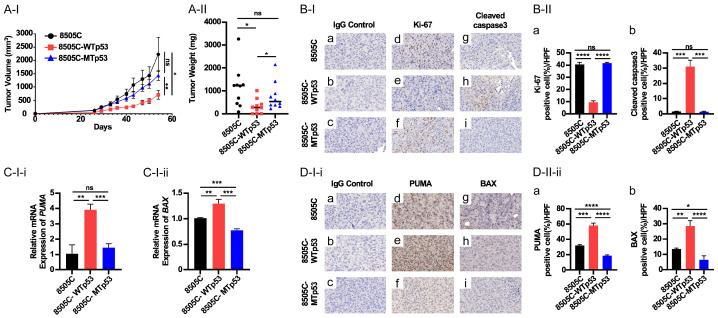
WTp53 suppresses xenograft tumor growth induced by 8505C cells. (A) Comparison of xenograft tumors induced by 8505C, 8505C-WTp53, and 8505C-MTp53 cells. Growth curve (I), and weight (II) of induced xenograft tumors. (B-I) Immunostaining of the proliferation marker, Ki-67 (d-f) and apostolic marker, cleaved caspase 3 (g-i) in tumors induced by 8505C, 8505C-WTp53, and 8505C-MTp53, respectively. (B-II) Quantitation of cell positively immune-stained cells with Ki-67 (a) and cleaved caspase 3 (b). (C-I) Comparison of the expression of PUMA (i) and BAX (ii) by q/PCR in tumors induced by 8505C, 8505C-WTp53, and 8505C-MTp53 (n=3). (D-I) Representative IHC images (i) and quantitative analysis of IHC results (ii, n=3) for PUMA (d-f) and BAX (g-i). Significant differences are indicated by asterisks (*P<0.05, **P<0.01, ***P<0.001, and ****P<0.0001). Data represent the mean ± SD (n=3).

