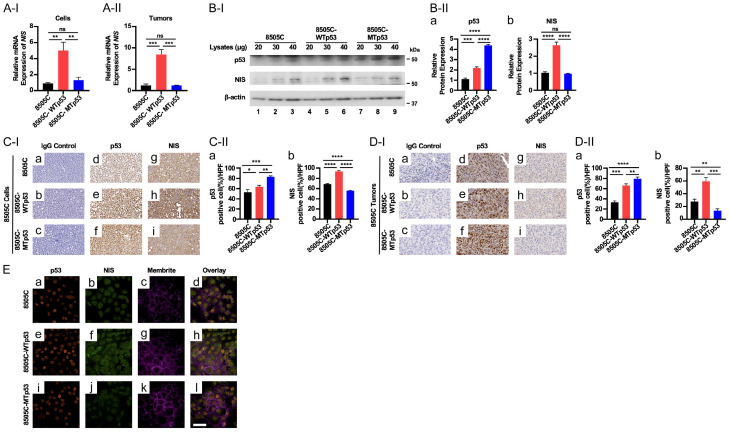
Figure 5.
WTp53 increases the expression of the SLC5A5 gene at the mRNA and protein levels. (A) Comparison of the expression of the SLC5A5 gene at the mRNA levels by q/PCR analysis in 8505C, 8505C-WTp53, and 8505C-MTp53 cells (A-I) and tumors induced by 8505C, 8505C-WTp53, 8505C-MTp53 cells (A-II). (B) Representative western blots showing increased p53 (top row) and NIS proteins (middle row) in 8505C, 8505C-WTp53, and 8505C-MTp53 cells. B-actin was used as loading controls (bottom row) (B-I). Quantitation of the band intensities in (B-II) showing the protein levels of p53 (a) and NIS protein (b). (C and D) Analysis of protein levels of p53 and NIS by IHC analysis [(C-I and D-I), representative images of IHC from cultured cell pellets and tumors, respectively; (C-II and D-II), quantitation of the cells immuno-stained for p53 (a) and NIS proteins (b)]. Significant differences are indicated by asterisks (*P<0.05, **P<0.01, ***P<0.001, and ****P<0.0001). Data represent the mean ± SD (n=3). (E) Confocal images of 8505C cells (top row), 8505C cells expressing WTp53 (middle row) and 8505C cells expressing mutant p53 (bottom row) immunolabeled against p53 (red; a, e and i) or NIS (green; b, f and j) and counterstained with MemBrite 640 plasma membrane stain (magenta). The merged of p53, NIS and MemBrite 640 (d, e and l). Scale bar =50 µm.

