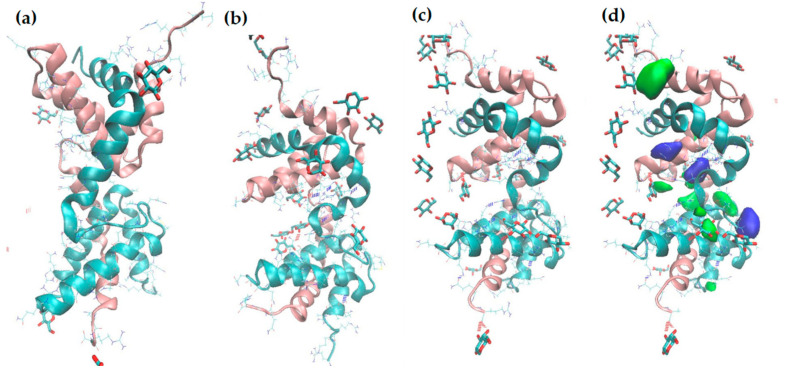
Figure 7.
Snapshots from the MD simulation of the first replica: (a) initial structure, (b) after 150 ns, (c) final structure, after 500 ns. (d) The same structure as in (C), superimposed with the volumetric map, representing the occupancy by glucose molecules; blue: α-D-glucose; green: β-D-glucose.

